Double Top and Double Bottom Patterns: Strategy Guide for Traders
Introduction
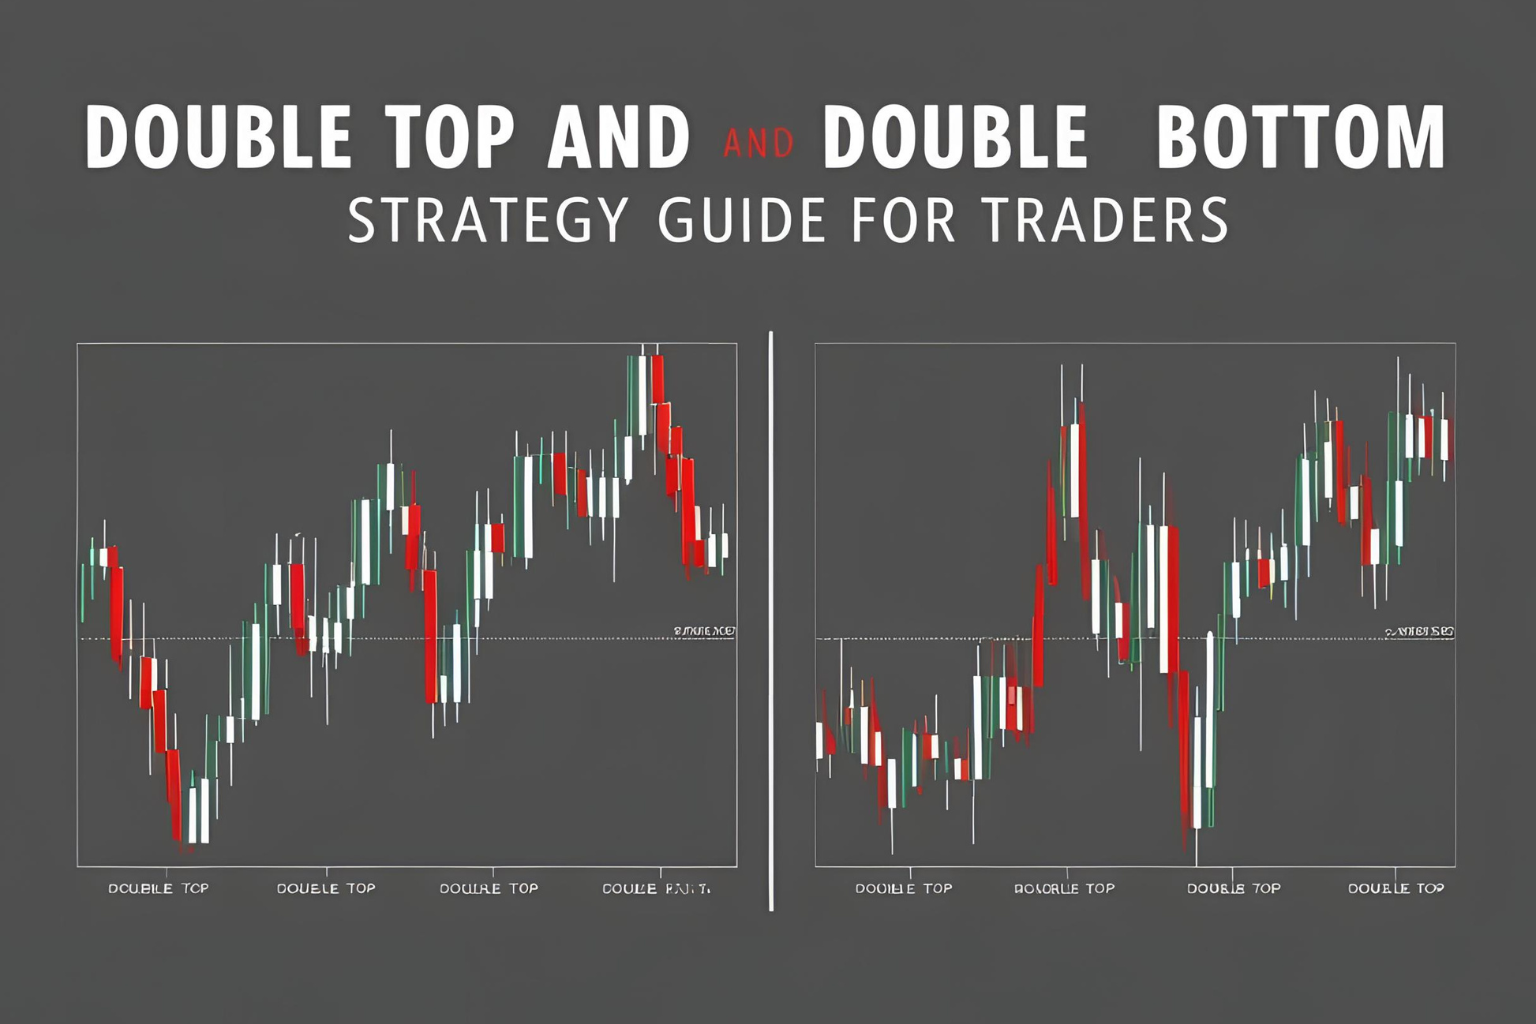
The double top and double bottom chart patterns are two of the most recognizable and reliable reversal patterns in technical analysis. Whether you’re trading stocks, futures, forex, or crypto, these patterns can help you identify potential trend reversals and time your trades more effectively. In this guide, we’ll explain how to trade both patterns with confidence.
What Is a Double Top Pattern?
The double top is a bearish reversal pattern that forms after an uptrend. It resembles the letter “M” and signals that buying pressure has peaked twice at the same level.
Structure:
- Two price peaks at a similar resistance level
- A neckline (support line) between the peaks
- Breakdown below the neckline confirms the pattern
Entry Signal:
Short trade after the price closes below the neckline.
Stop Loss:
Just above the second peak.
Profit Target:
Measure the height between the peaks and the neckline, then project downward.
What Is a Double Bottom Pattern?
The double bottom is a bullish reversal pattern that forms after a downtrend. It resembles the letter “W” and indicates a strong support zone where buyers regain control.
Structure:
- Two price troughs at a similar support level
- A neckline (resistance line) between the troughs
- Breakout above the neckline confirms the pattern
Entry Signal:
Long trade after breakout above the neckline.
Stop Loss:
Just below the second bottom.
Profit Target:
Height between neckline and bottom, projected upward.
Key Characteristics
| Pattern | Market Sentiment | Signal Type | Shape |
|---|---|---|---|
| Double Top | Bearish Reversal | Sell | M-shape |
| Double Bottom | Bullish Reversal | Buy | W-shape |
Timeframes & Markets
- Stocks: Best on daily or 4H charts
- Forex: Effective on 1H and 4H
- Crypto: Reliable on 4H and Daily (BTC, ETH)
- Futures: Great for intraday setups (15m to 1H)
Example Trade: Double Bottom on BTC/USDT
- Timeframe: 4H
- Entry: Break above neckline after two bounces at support
- Stop: Below the second bottom
- Target: Same distance as from neckline to bottom, projected upward
Common Mistakes to Avoid
- Premature Entry: Wait for confirmation with a breakout.
- Ignoring Volume: Look for rising volume on the breakout.
- Tiny Patterns on Small Timeframes: Avoid unreliable setups on 1min or 5min charts.
Best Tools for Pattern Recognition
- TradingView Pattern Drawing Tool
- Auto Chartist / Pattern recognition plugins
- Volume Indicator – to confirm breakout strength
- RSI / MACD – to spot divergence and trend shifts
FAQs
Are double top and bottom patterns reliable?
Yes, especially when confirmed with volume and breakout.
What timeframe is best for double top and double bottom patterns?
4H and Daily for swing trading; 1H for intraday.
Can these patterns fail?
Yes. Always use stop-loss and risk management. Patterns provide probability, not certainty.
Can I use these patterns for crypto?
Absolutely. They appear frequently in BTC, ETH, and major altcoins.
What confirms a valid double top or bottom?
A clear breakout of the neckline with volume increase confirms validity.