Bullish vs Bearish Chart Patterns Explained for Traders
Introduction
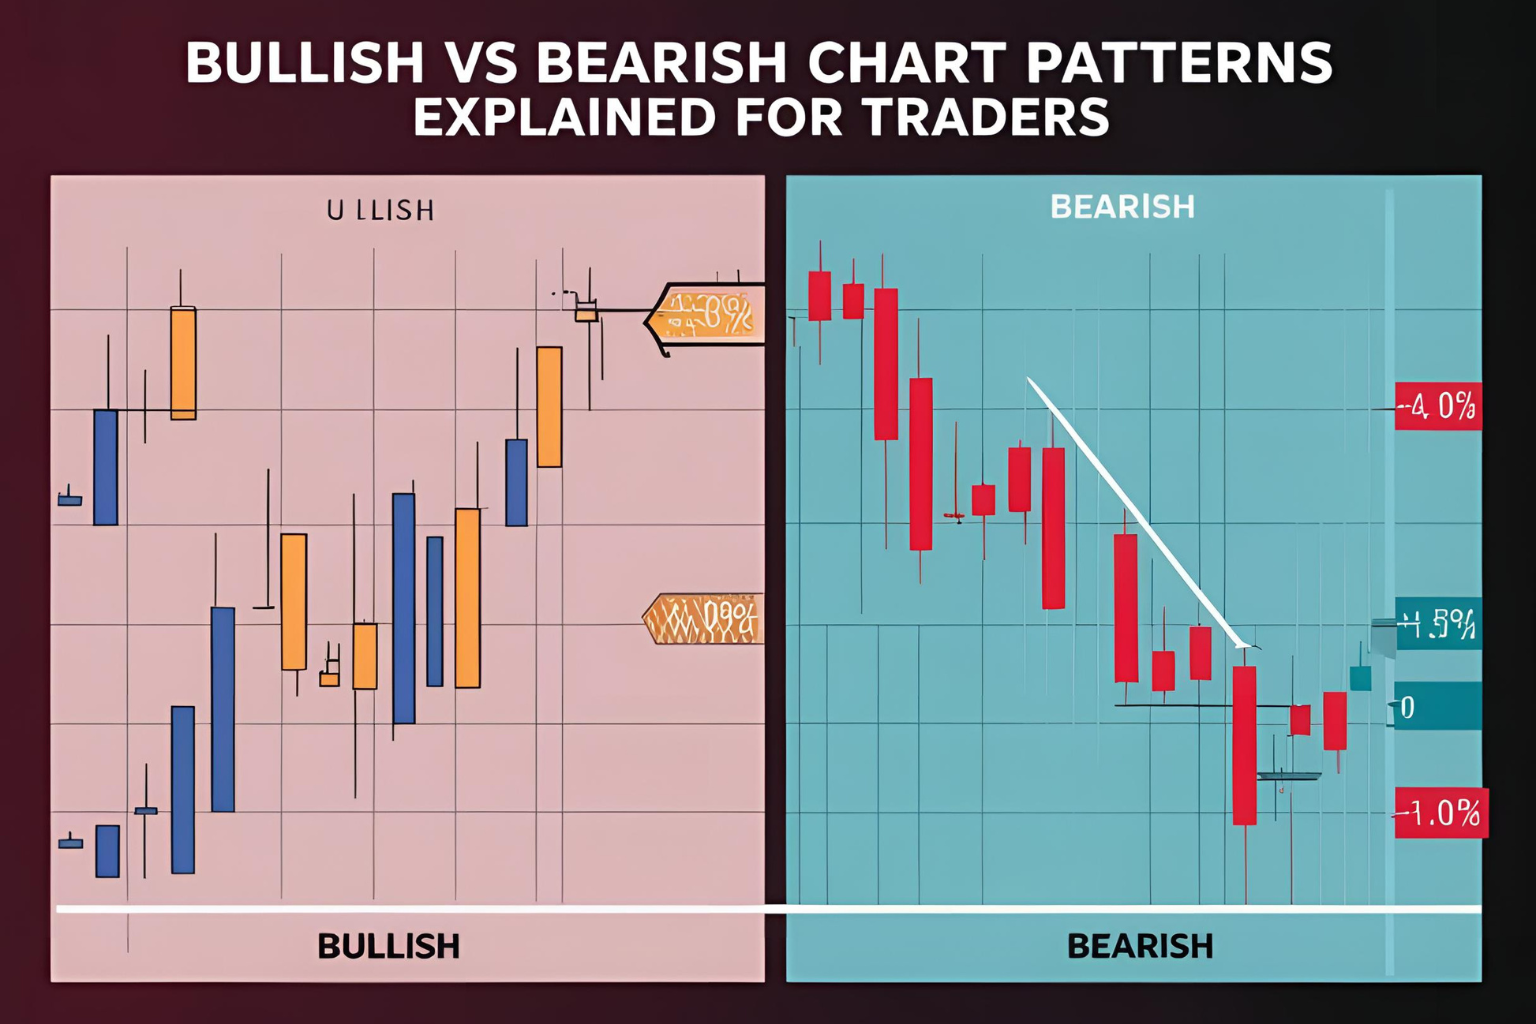
Recognizing the difference between bullish and bearish chart patterns is essential for any trader. These patterns can signal trend continuations or reversals and are widely used in stock, forex, futures, and crypto trading. In this guide, we’ll break down what bullish and bearish patterns look like, how they form, and how you can trade them effectively.
What Are Bullish Chart Patterns?
Bullish chart patterns indicate a likely upward movement in price. They typically form after a downtrend or during a pause in an uptrend and suggest that buyers are gaining strength.
Common Bullish Chart Patterns:
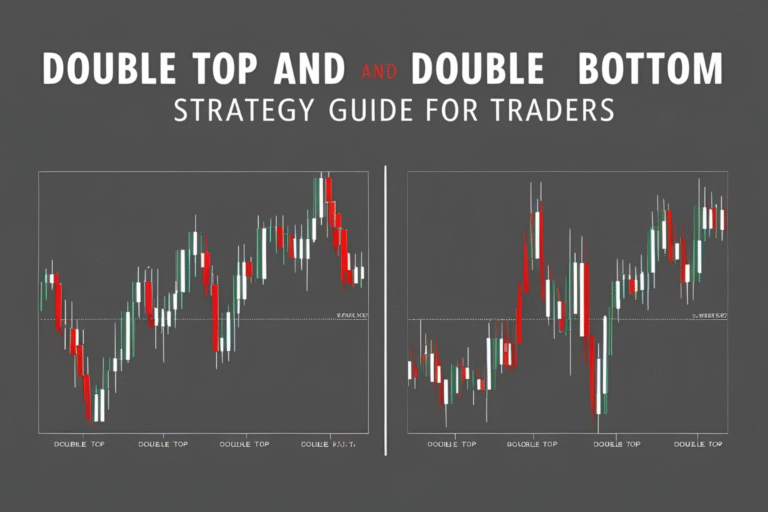
- Double Bottom – A “W” shaped reversal pattern.
- Cup and Handle – A consolidation followed by a breakout.
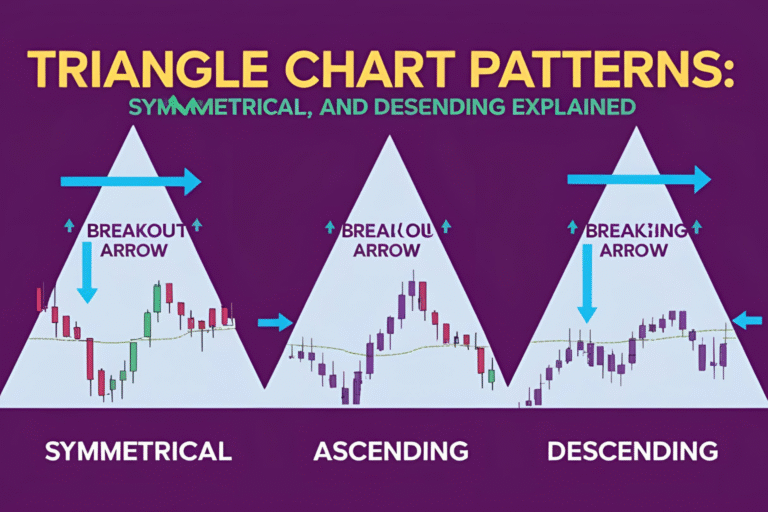
- Ascending Triangle – Price forms higher lows against a horizontal resistance.
- Bull Flag – A short pause after a strong upward move.
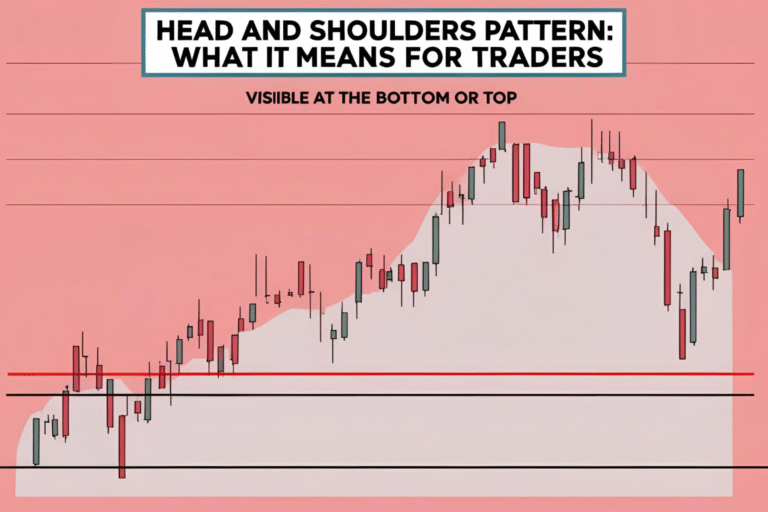
- Inverse Head and Shoulders – A bullish reversal pattern.
When to Trade Them:
Bullish patterns are ideal for long trades when confirmed by a breakout and supported by volume or indicators like RSI crossing above 50.
What Are Bearish Chart Patterns?
Bearish chart patterns signal a likely downward movement in price. They form after an uptrend or during a pause in a downtrend, showing that sellers are taking control.
Common Bearish Chart Patterns:
- Double Top – An “M” shaped reversal.
- Head and Shoulders – A topping pattern indicating weakness.
- Descending Triangle – Price forms lower highs with support at a horizontal line.
- Bear Flag – A pause before a continued drop.
- Rising Wedge – Appears bullish initially but breaks down.
When to Trade Them:
Bearish patterns are used to take short trades or exit long positions. Look for confirmation with volume spikes and bearish indicator signals (e.g., MACD crossover, RSI below 50).
Key Differences Between Bullish and Bearish Patterns
| Feature | Bullish Patterns | Bearish Patterns |
|---|---|---|
| Direction | Upward breakout expected | Downward breakout expected |
| Formed After | Downtrend or consolidation | Uptrend or consolidation |
| Trader Action | Consider long entries | Consider short entries |
| Examples | Inverse H&S, Cup & Handle | Head & Shoulders, Double Top |
How to Confirm Pattern Direction
To increase the reliability of your analysis:
- Volume: Confirm with volume expansion during breakout.
- Indicators: Use MACD, RSI, or moving averages for confirmation.
- Breakout Price Levels: Set alerts at neckline or trendline breakout points.
Tips for Trading Bullish and Bearish Patterns
- Trade only after the breakout, not before.
- Set stop losses below support (for bullish) or above resistance (for bearish).
- Adjust your position size based on risk-to-reward ratio.
- Use higher timeframes for better reliability.
FAQs
How can I quickly identify if a pattern is bullish or bearish?
Check the trend before and the expected breakout direction. Patterns forming after a downtrend are often bullish and vice versa.
Which is more profitable: bullish or bearish chart patterns?
Both can be profitable. The key lies in proper identification and confirmation.
Do bullish and bearish patterns work in all markets?
Yes, these patterns work in stocks, forex, futures, and crypto due to universal trader behavior.
Should I use indicators with chart patterns?
Yes, combining patterns with indicators like RSI or MACD increases accuracy.
What timeframe is best for spotting bullish and bearish patterns?
Daily and 4-hour charts offer higher reliability, especially for beginners.