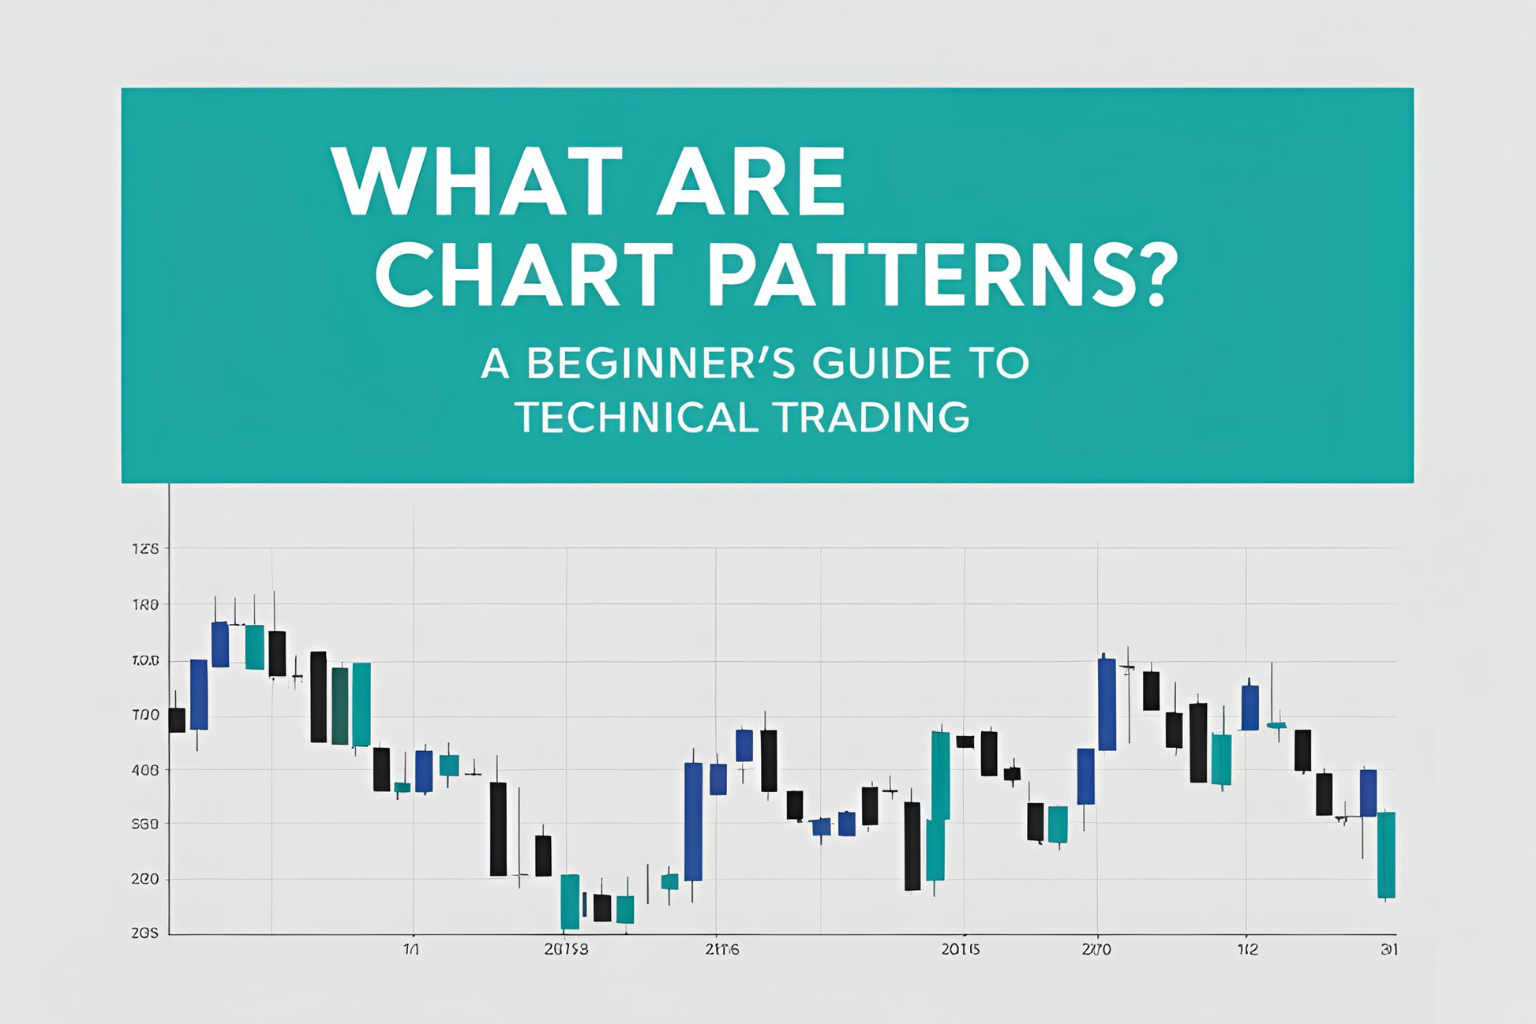
What Are Chart Patterns? A Beginner’s Guide to Technical Trading
Introduction
Chart patterns are one of the most popular tools in technical analysis. They visually represent the battle between buyers and sellers and can help traders anticipate market movements. Whether you trade stocks, futures, forex, or crypto, learning to recognize chart patterns is a foundational skill for making informed decisions.
What Are Chart Patterns?
Chart patterns are visual formations created by price movements on a trading chart. These patterns signal potential continuation or reversal in the direction of price trends. Traders use them to make predictions based on historical market behavior.
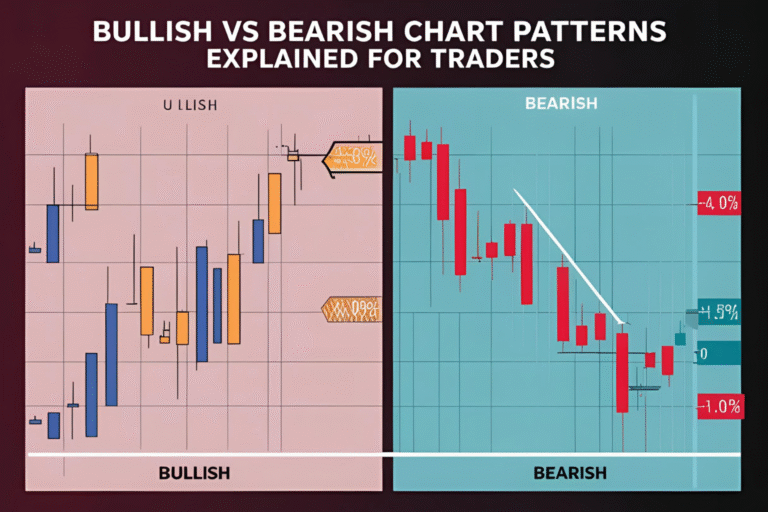
There are two main types:
- Reversal Patterns – Signal that a trend is likely to reverse.
- Continuation Patterns – Indicate that the current trend is likely to continue.
Why Are Chart Patterns Important?
- Predictive Power: Patterns often repeat due to consistent human behavior in financial markets.
- Strategic Entries & Exits: They offer clues for when to enter or exit a trade.
- Versatility: They work across markets including stocks, forex, futures, and crypto.
Common Chart Patterns for Beginners
Here are a few widely used patterns that beginners should learn:
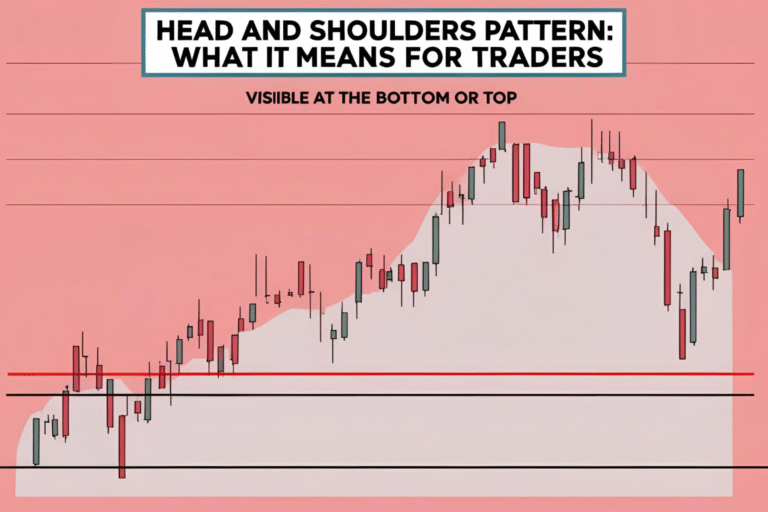
1. Head and Shoulders
Indicates a reversal after a trend. A “head” between two “shoulders” marks the turning point.
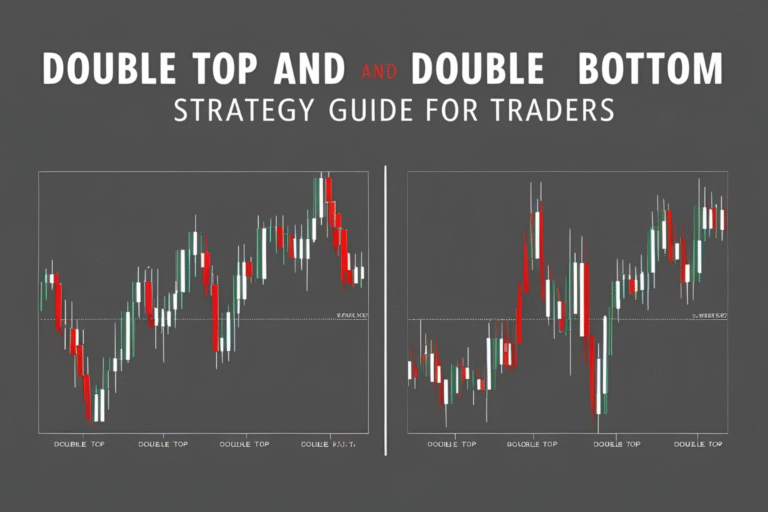
2. Double Top and Double Bottom
These patterns signal a strong resistance or support level and a likely trend reversal.
3. Cup and Handle
A bullish continuation pattern that looks like a teacup.
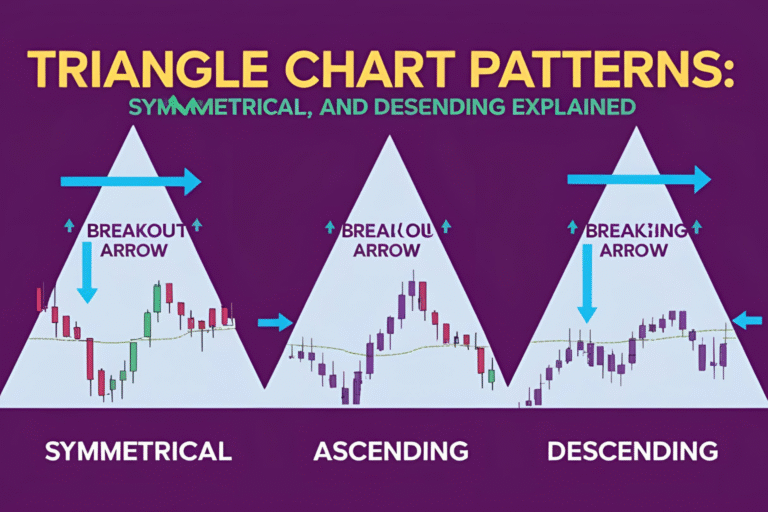
4. Triangles (Ascending, Descending, Symmetrical)
Used to anticipate breakout directions.
5. Flags and Pennants
Short-term continuation patterns following sharp price moves.
How to Read a Chart Pattern
- Identify the Trend: Understand the context—uptrend, downtrend, or sideways.
- Locate the Pattern Shape: Look for repeatable geometric shapes forming.
- Volume Confirmation: Volume typically declines during formation and spikes at breakout.
- Set Targets: Measure the height of the pattern and project it from the breakout point.
Chart Patterns in Different Markets
- Stock Market: Used on daily and weekly charts to spot breakouts and trend reversals.
- Forex: Works well on intraday timeframes like 1H and 4H charts.
- Futures: Pattern behavior is often consistent across E-mini, crude oil, or gold contracts.
- Crypto: Bitcoin and altcoins often follow classic chart patterns due to speculative crowd behavior.
Tips for Beginners
- Start with clean charts—remove unnecessary indicators.
- Practice pattern recognition using historical data.
- Combine with indicators like RSI or MACD for confirmation.
- Avoid trading solely based on one pattern—use context and risk management.
FAQs
What is the easiest chart pattern for beginners to learn?
The double top and double bottom are among the simplest and most recognizable patterns.
Can chart patterns be used in crypto trading?
Yes, chart patterns work well in crypto due to high volatility and market psychology.
Do chart patterns really work?
While not guaranteed, they offer probabilistic setups backed by historical behavior.
What timeframes are best for using chart patterns?
Daily and 4-hour timeframes are ideal for reliable patterns, especially for beginners.
Are chart patterns better than indicators?
They are complementary—many traders combine patterns with indicators for confirmation.