How to Identify Breakout Patterns in Real-Time Trading
Introduction
Breakout chart patterns signal the start of explosive moves in price, often after a period of consolidation. Identifying these patterns in real-time can give traders an edge across markets—from stocks and forex to crypto and futures. This guide walks you through how to spot and confirm breakout patterns before the move happens, so you can enter trades early with confidence.
What Are Breakout Chart Patterns?
A breakout occurs when price moves beyond a key support or resistance level with increased volume. Chart patterns that precede breakouts include triangles, flags, wedges, and rectangles.
Why Breakouts Matter:
- They indicate strong momentum
- Offer clear entry and exit points
- Can lead to high reward-to-risk trades
Most Common Breakout Patterns
1. Ascending Triangle
- Flat resistance, rising support
- Bullish breakout expected
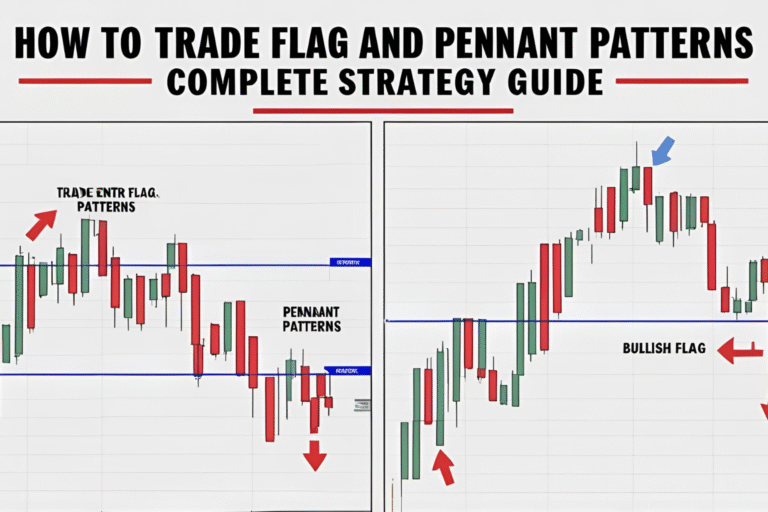
2. Bull Flag
- Sharp move followed by short consolidation
- Continuation breakout setup
3. Wedge (Falling/Rising)
- Tighter price action before breakout
- Falling wedge = bullish; rising wedge = bearish
4. Rectangle
- Horizontal support and resistance
- Breakout direction defines trade setup
How to Identify Breakouts in Real-Time
1. Draw Clear Support and Resistance Lines
Mark horizontal or diagonal levels from recent highs and lows.
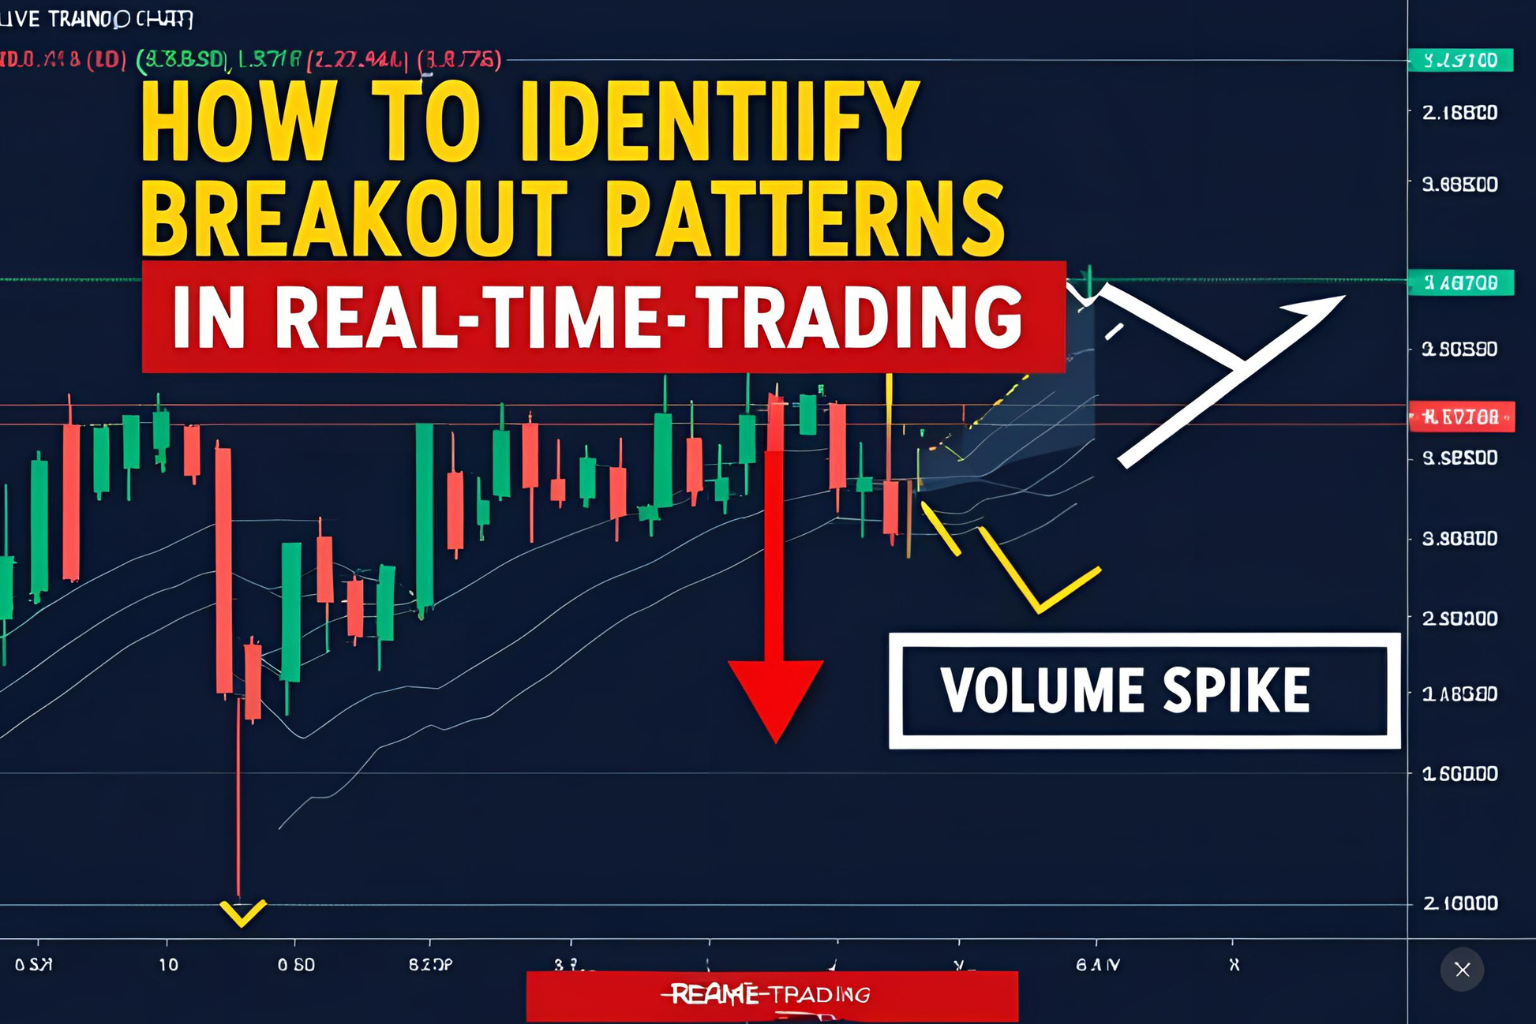
2. Monitor Volume
Breakouts should be accompanied by increased volume. Weak volume = potential false breakout.
3. Watch for Candlestick Signals
- Bullish: Bullish engulfing, Marubozu
- Bearish: Bearish engulfing, long upper wick
4. Use Multi-Timeframe Confirmation
Breakouts on the 1H chart confirmed by the 4H or Daily increase reliability.
Tools to Spot Breakout Patterns Early
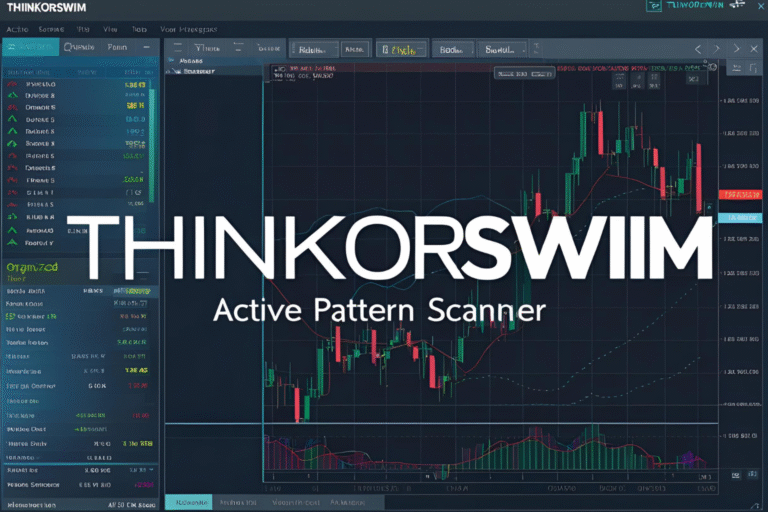
- Trendlines and Chart Drawing Tools (TradingView, ThinkorSwim)
- Volume Indicators
- Breakout Scanners (Finviz, TradingView built-in screeners)
- Alerts & Triggers (set price alerts at resistance/support)
Example: Breakout Trade on NASDAQ Futures
- Setup: Symmetrical triangle forming on 4H chart
- Resistance: 15,200
- Breakout: Bullish breakout with volume spike
- Entry: After price closes above 15,200
- Stop Loss: Below previous low inside the triangle
- Target: Measure height of pattern and project from breakout
Tips to Avoid False Breakouts
- Wait for candle close beyond breakout level, not just a wick
- Confirm with volume—it should expand on the breakout
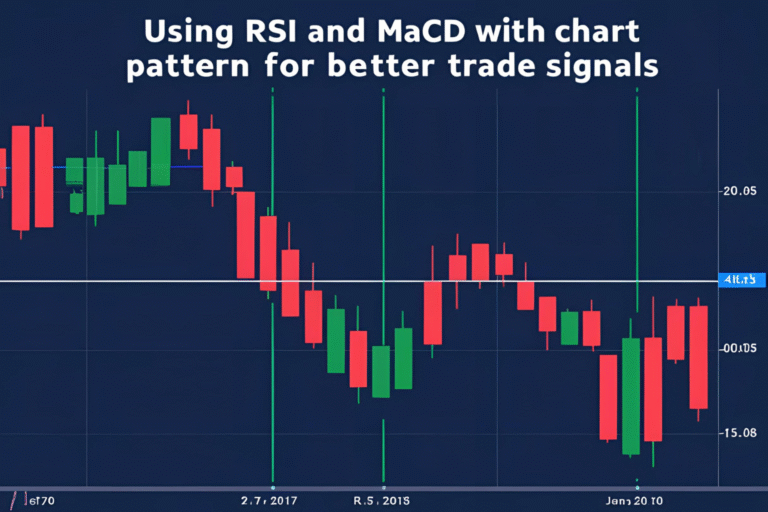
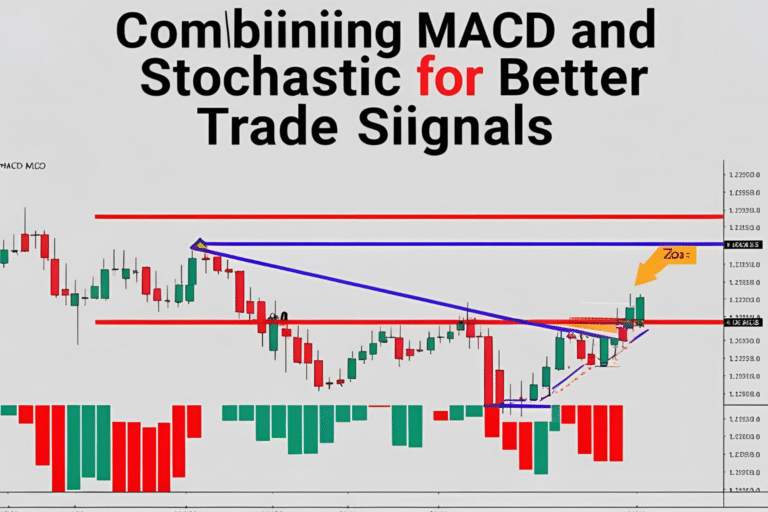
- Use RSI or MACD to support direction bias
- Avoid trading breakouts during low volume sessions
FAQs
What is the best pattern for breakout trading?
Ascending triangles and bull flags are among the most reliable breakout patterns.
How do I confirm a breakout?
With a full candle close beyond key levels and increased volume.
Do breakouts fail?
Yes. These are called false breakouts. Use stop-loss protection and confirmation tools.
Can I use breakout strategies in crypto and forex?
Absolutely. Breakouts occur frequently in BTC, ETH, EUR/USD, and more.
What’s the best timeframe to spot breakouts?
1H, 4H, and Daily charts provide a balance of reliability and speed.