How to Scan for Chart Patterns in ThinkorSwim (TOS)
Introduction
ThinkorSwim (TOS) by TD Ameritrade is one of the most advanced trading platforms available. It offers powerful scanning capabilities, including ways to scan chart patterns across multiple stocks and ETFs. Whether you’re looking for flags, triangles, or double bottoms, this guide shows you how to set up custom and built-in scans for pattern-based trading in ThinkorSwim.
Why Use ThinkorSwim to Scan Chart Patterns?
- Real-time Scanning: Detect patterns as they form
- Custom Script Support: Build your own pattern conditions
- Multi-timeframe Scans: Run scans on intraday or daily charts
- Integrated Alerts: Get notified when setups trigger
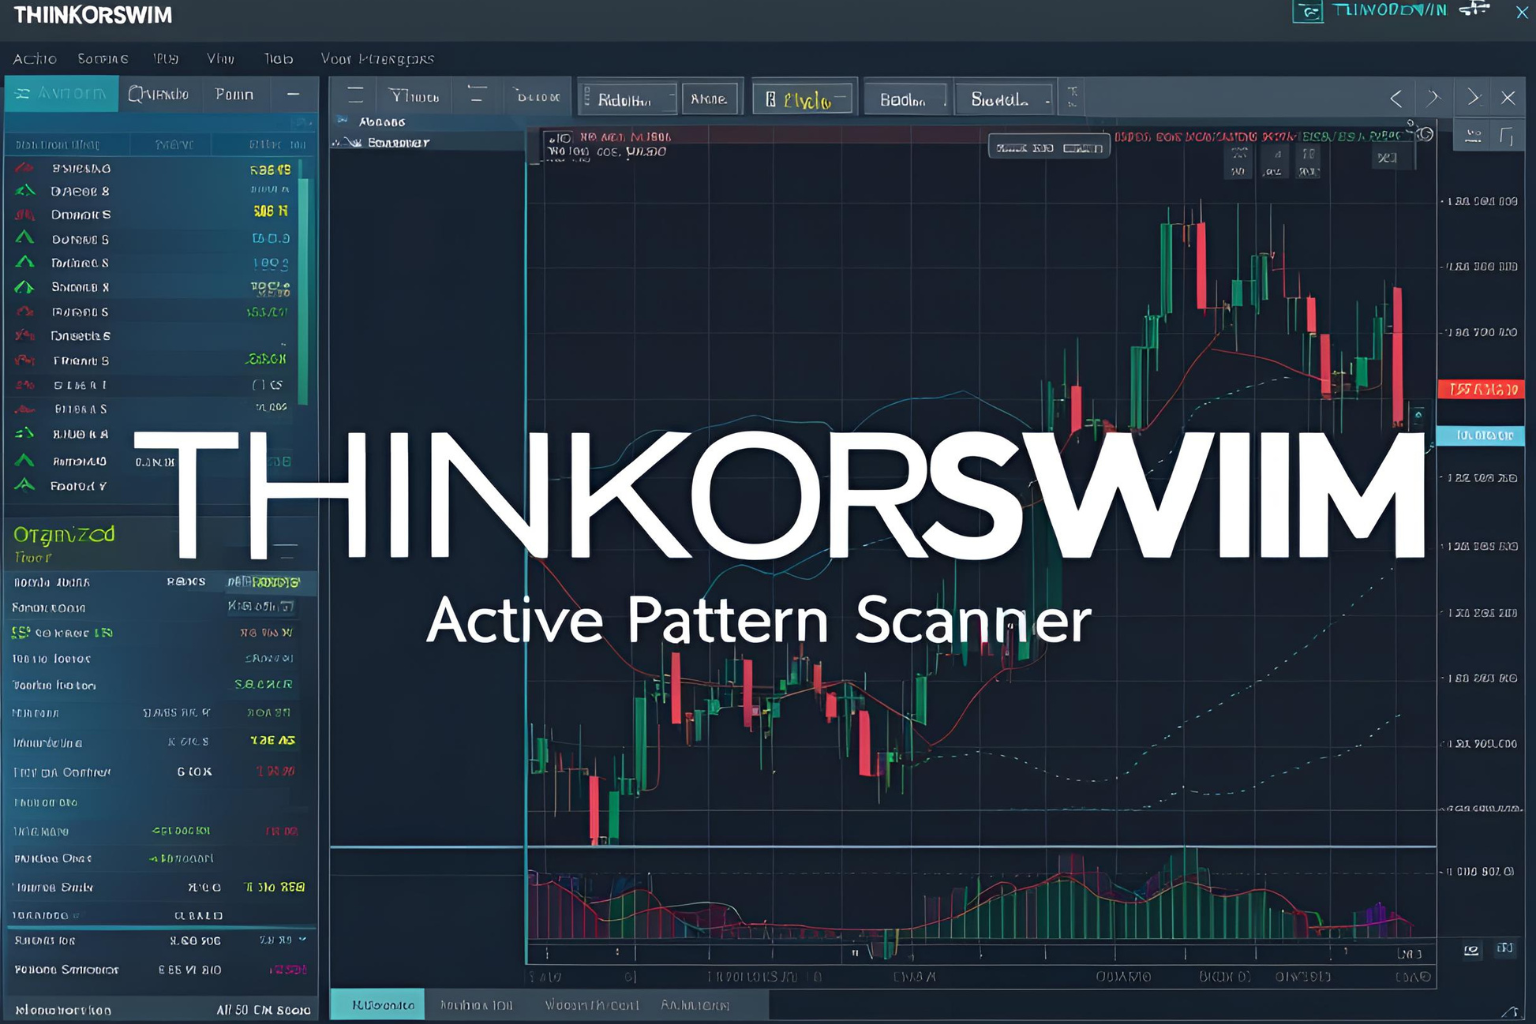
Getting Started: Accessing the Scan Tool
- Launch ThinkorSwim Desktop App
- Go to the “Scan” tab at the top
- Click on “Stock Hacker” for customizable scanning
- Choose your watchlist or universe (e.g., S&P 500, all stocks, ETFs)
Method 1: Using Built-In Study Filters
TOS provides built-in technical studies that can mimic pattern behavior.
Example for Double Bottom Logic:
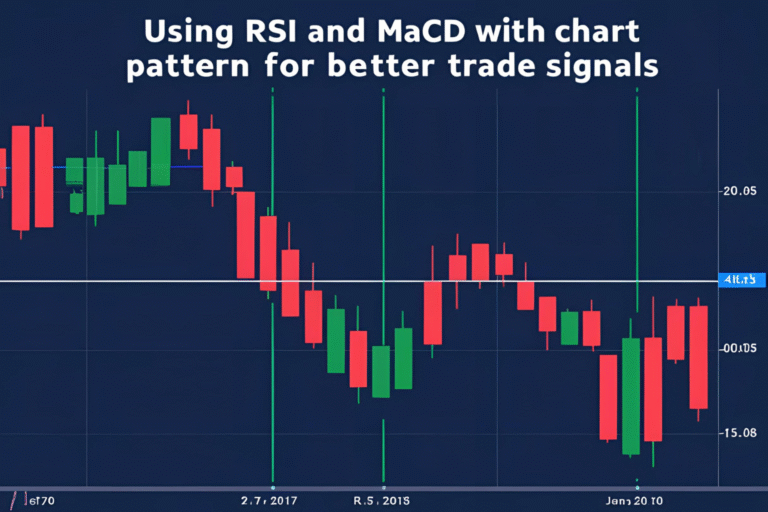
- Use RSI crossing above 50
- Price near a prior support level
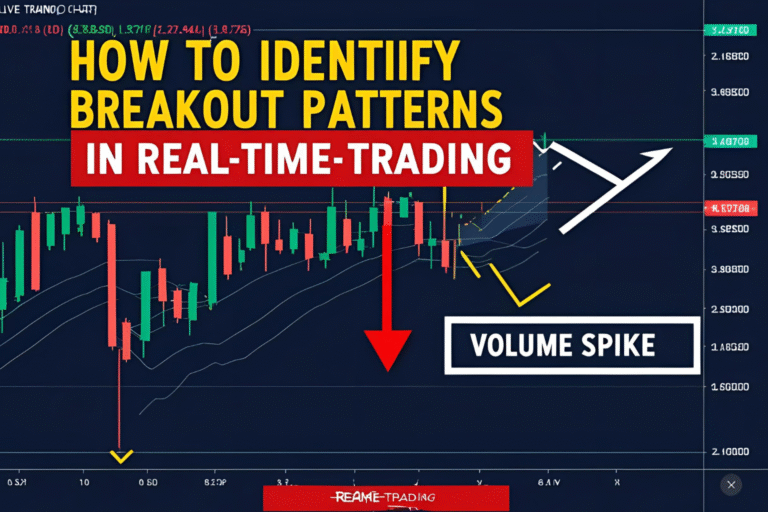
- Volume spike on breakout
Steps:
- Click “Add filter” > “Study”
- Select indicators like RSI, MACD, or price crossover
- Combine multiple conditions to reflect your target pattern
Method 2: Custom ThinkScript for Patterns
If you want more advanced recognition, use ThinkScript to define custom conditions.
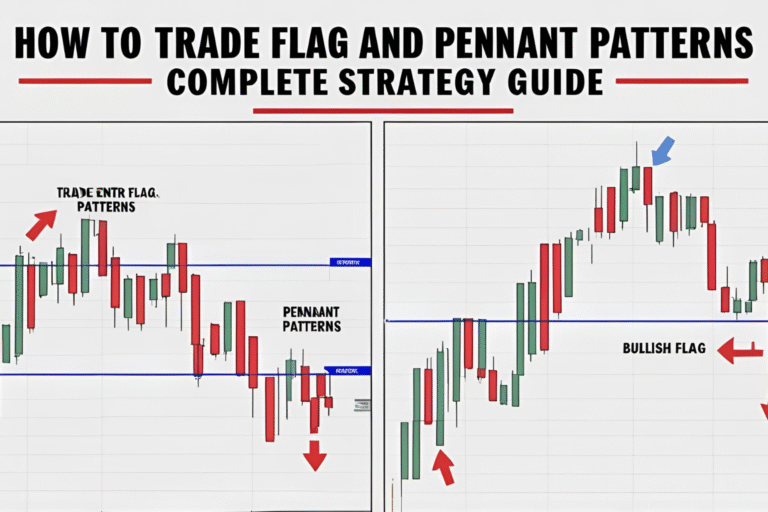
Example: Bull Flag Scan (simplified)
thinkscriptCopyEditdef upTrend = close > close[1] and close[1] > close[2];
def pullback = close[1] < close[2] and close < close[1];
plot signal = upTrend and pullback;
Steps to Use:
- Click “Add filter” > “Study” > “Custom”
- Paste your script
- Name it and save
- Click “Scan” to apply across your selected list
Best Chart Patterns to Scan in ThinkorSwim
| Pattern | Scan Components |
|---|---|
| Bull Flag | Strong price move + slight pullback + volume filter |
| Double Bottom | Price bouncing near same support level + RSI confirmation |
| Head & Shoulders | Lower highs, neckline break (harder to script) |
| Ascending Triangle | Flat top resistance + higher lows (manual or semi-auto) |
Pro Tips
- Use relative volume to filter valid breakouts
- Run scans during pre-market and mid-day to catch patterns early
- Combine fundamentals (like earnings) with chart pattern scans for better setups
- Backtest your scan results by reviewing recent chart hits manually
Limitations of TOS Pattern Scanning
- No native “pattern recognition engine” like TradingView or TrendSpider
- Head and shoulders or triangles require creative scripting
- Works best for confirming breakout setups, not just raw pattern shapes
FAQs
Can ThinkorSwim automatically detect chart patterns?
Not exactly. It doesn’t have built-in pattern recognition like other platforms, but you can scan for key technical setups that often lead to patterns.
Is ThinkScript difficult to learn?
Basic scripts are easy to pick up. TD Ameritrade offers tutorials, and you can find shared scans online.
Can I scan for patterns on options or ETFs?
Yes, the scanner works across stocks, ETFs, and even options chains (with limited pattern logic).
What’s the best timeframe for scanning patterns in TOS?
4H and Daily charts are most reliable for swing trading setups.
Are there community-shared scripts for chart patterns?
Yes. Sites like useThinkScript.com have free shared scans for common patterns