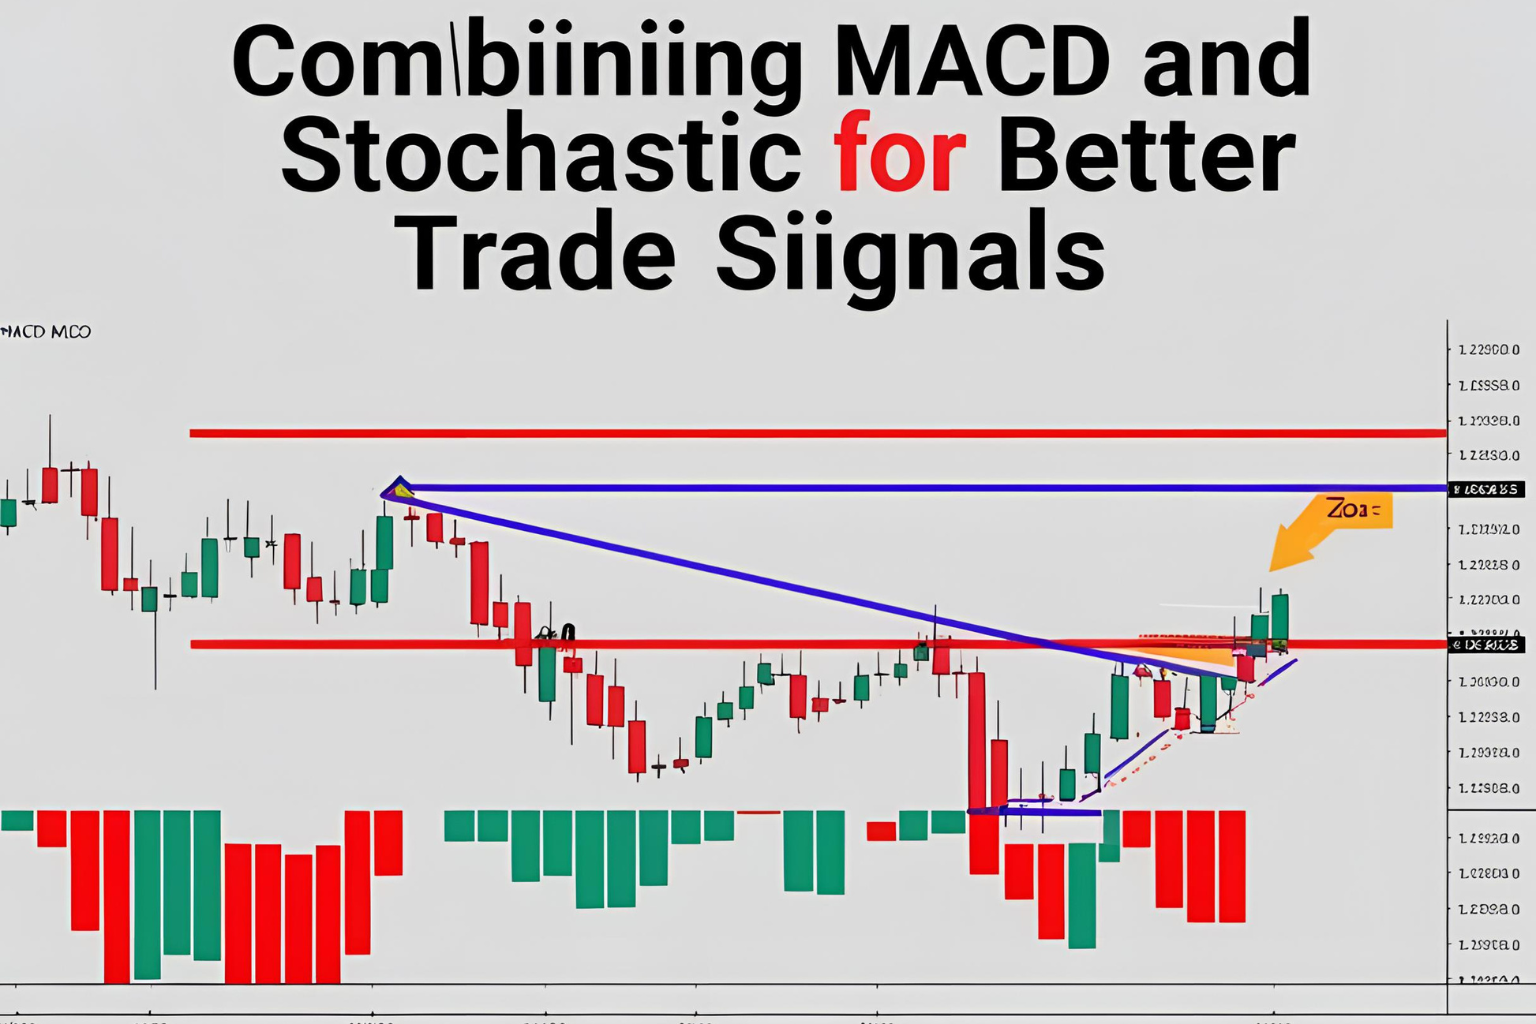
Combining MACD and Stochastic for Better Trade Signals
Introduction
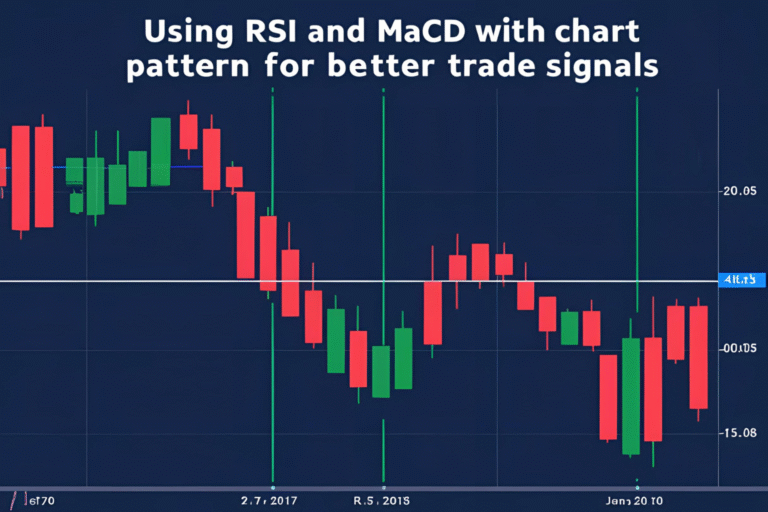
MACD and Stochastic Oscillator are two of the most widely used momentum indicators in technical analysis. When combined with chart patterns, they can help filter out weak setups and provide clearer entry and exit signals. In this post, you’ll learn how combining MACD and Stochastic enhances your pattern-based trading strategy across stocks, forex, crypto, and futures.
Why Combine MACD and Stochastic?
Each indicator provides a different view of market momentum:
- MACD tracks the trend and momentum of price moves
- Stochastic shows overbought or oversold conditions
Using them together helps confirm:
- Breakouts and reversals from chart patterns
- Trend continuation signals
- Divergence and momentum shifts
How MACD Works
- MACD Line = Difference between 12-EMA and 26-EMA
- Signal Line = 9-EMA of the MACD line
- Histogram = Distance between MACD and Signal line
Bullish Signal: MACD line crosses above the signal line
Bearish Signal: MACD line crosses below the signal line
How Stochastic Works
- Measures the closing price relative to recent highs/lows
- Uses %K and %D lines for signal generation
Bullish Signal: %K crosses above %D from below 20 (oversold)
Bearish Signal: %K crosses below %D from above 80 (overbought)
How to Use MACD + Stochastic with Chart Patterns
✅ Entry Example: Bull Flag Pattern
- Pattern forms after a strong upward move
- MACD histogram turns positive; crossover happens
- Stochastic crosses up from below 20
- Breakout occurs from the flag = entry signal
✅ Entry Example: Double Bottom
- Price forms two lows on chart
- MACD crossover near second bottom
- Stochastic shows bullish divergence
- Breakout above neckline = confirmed trade setup
Advantages of Using Both Together
| Benefit | Explanation |
|---|---|
| Improves Accuracy | Confirms the strength of a chart pattern breakout |
| Filters Noise | Helps avoid false signals on low-quality setups |
| Shows Momentum + Extremes | MACD shows trend, Stochastic shows extremes |
| Great for Swing Trading | Works well on 1H, 4H, and Daily timeframes |
Best Timeframes and Markets
- Stocks: Daily and 4H (AAPL, TSLA, MSFT)
- Forex: 1H and 4H (EUR/USD, GBP/JPY)
- Crypto: 4H and Daily (BTC/USDT, ETH/USDT)
- Futures: Intraday (ES, NQ, CL) or swing on 4H
Pro Tips for Traders
- Don’t enter trades on indicators alone—wait for pattern confirmation
- Avoid trading when MACD and Stochastic give conflicting signals
- Use Stochastic divergence for early reversal alerts
- Combine with volume confirmation for stronger trades
FAQs
Can I use MACD and Stochastic on the same chart?
Yes, many platforms support overlaying both indicators below your main price chart.
Do I need both indicators for every trade?
Not necessarily, but combining them significantly improves confirmation and reduces false entries.
What is the best timeframe for this combo?
4H and Daily charts offer strong reliability for swing trades.
Do these indicators repaint or lag?
MACD and Stochastic are lagging indicators—they work best for confirmation, not prediction.
Can I automate this strategy?
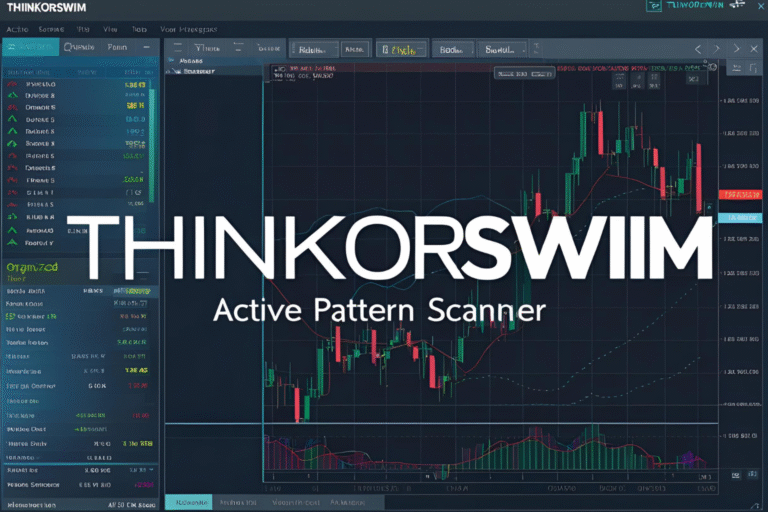
Yes, with tools like TradingView Pine Script or Thinkorswim ThinkScript.