combining macd and stochastic

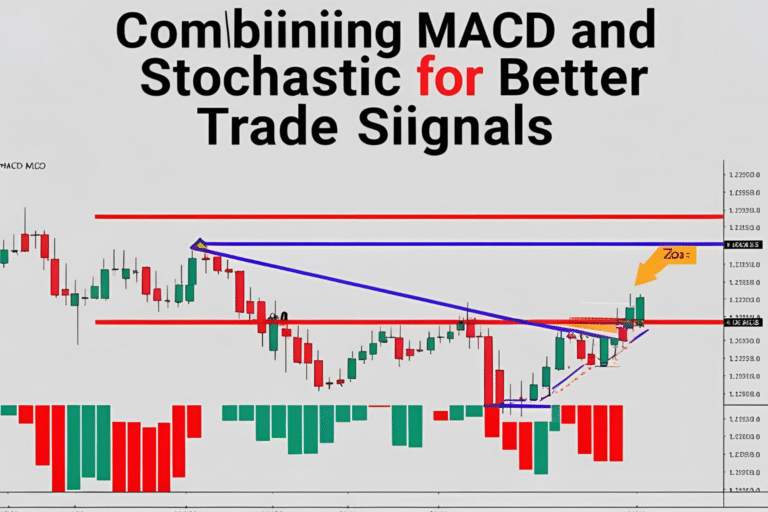
Combining MACD and Stochastic for Better Trade Signals

IntroductionMACD and Stochastic Oscillator are two of the most widely used momentum indicators in technical analysis. When combined with chart patterns, they can help filter out weak setups and provide clearer entry and exit signals. In this post, you’ll learn how combining MACD and Stochastic enhances your pattern-based trading strategy across stocks, forex, crypto, and…

daily vs weekly chart patterns

Daily vs Weekly Timeframes: Best Use of Chart Patterns

IntroductionChoosing the right timeframe is critical when trading chart patterns. While some traders prefer quick trades on daily charts, others find greater accuracy and stronger signals on weekly charts. In this post, we’ll break down the pros and cons of daily vs weekly chart patterns so you can choose the best approach for your strategy—whether…

scan chart patterns thinkorswim

How to Scan for Chart Patterns in ThinkorSwim (TOS)

IntroductionThinkorSwim (TOS) by TD Ameritrade is one of the most advanced trading platforms available. It offers powerful scanning capabilities, including ways to scan chart patterns across multiple stocks and ETFs. Whether you’re looking for flags, triangles, or double bottoms, this guide shows you how to set up custom and built-in scans for pattern-based trading in…

How to Backtest Chart Patterns Effectively: A Step-by-Step Guide

How to Backtest Chart Patterns Effectively: A Step-by-Step Guide

IntroductionBefore trading chart patterns with real money, it’s essential to know whether they actually work. That’s where backtesting comes in. Backtesting allows traders to evaluate how a chart pattern has performed in the past under specific rules. In this post, you’ll learn exactly how to backtest chart patterns effectively to improve your trading accuracy and…

RSI and MACD with Chart Patterns

Using RSI and MACD with Chart Patterns for Better Trade Signals

IntroductionChart patterns offer a solid visual roadmap for price movements, but when paired with powerful indicators like RSI and MACD, their effectiveness improves significantly. These combinations help filter out false breakouts and provide confirmation for higher-probability trades. In this guide, you’ll learn how to use RSI and MACD with chart patterns to enhance trade entries…

Common Mistakes Traders Make with Chart Patterns

Common Mistakes Traders Make with Chart Patterns

IntroductionChart patterns can be powerful tools for predicting price movements—if used correctly. However, many traders fall into the trap of misidentifying setups, rushing entries, or ignoring confirmations. In this guide, we’ll highlight the most common chart pattern trading mistakes and how to avoid them so you can increase your success rate in stocks, crypto, forex,…

chart pattern examples

Real Examples of Chart Patterns from NASDAQ Stocks

IntroductionUnderstanding chart patterns in theory is helpful—but seeing them unfold in real market conditions is even more powerful. In this guide, we’ll walk through real chart pattern examples from popular NASDAQ stocks. These live market setups show how patterns like triangles, flags, and double bottoms actually work in trading environments. Why Use Real Chart Pattern…

chart pattern recognition tools

Chart Pattern Recognition Software: Best Tools for Traders

IntroductionManually spotting chart patterns can be time-consuming, especially when tracking multiple assets. That’s where chart pattern recognition tools come in—they automatically scan charts, identify setups, and help traders act faster. This post highlights the best software and platforms for chart pattern recognition in stocks, forex, crypto, and futures. Why Use Chart Pattern Recognition Tools? Top…

flag and pennant chart patterns

How to Trade Flag and Pennant Patterns: Complete Strategy Guide

IntroductionFlag and pennant chart patterns are powerful continuation setups that offer traders high-probability entries in trending markets. Known for their speed and clarity, these patterns frequently appear in stocks, forex, futures, and crypto—especially during strong momentum phases. This guide covers how to spot, confirm, and trade flag and pennant patterns like a pro. What Are…

high win rate chart patterns

Chart Patterns with High Win Rate: Backtest Results for Traders

IntroductionNot all chart patterns are created equal. Some consistently perform better than others, offering traders higher probabilities of success. In this post, we’ll share backtested results on chart patterns with high win rates, so you can focus your strategy on the most reliable setups in the market—whether you’re trading stocks, forex, futures, or crypto. What…