Daily vs Weekly Timeframes: Best Use of Chart Patterns
Introduction
Choosing the right timeframe is critical when trading chart patterns. While some traders prefer quick trades on daily charts, others find greater accuracy and stronger signals on weekly charts. In this post, we’ll break down the pros and cons of daily vs weekly chart patterns so you can choose the best approach for your strategy—whether you’re swing trading, position trading, or investing.
Why Timeframe Matters for Chart Patterns
- Pattern clarity changes with the timeframe
- Breakout reliability can vary by chart resolution
- Trade duration and risk are impacted by timeframe selection
Daily Chart Patterns: Advantages & Use Cases
Who It’s For: Swing traders, active position traders
✅ Advantages:
- More signals = more trade opportunities
- Faster entries and exits
- Patterns develop quicker—ideal for 1–10 day trades
- Common patterns: bull flags, triangles, double tops
🚫 Limitations:
- More noise and false breakouts
- Affected by intraday volatility
- Requires more monitoring and discipline
Weekly Chart Patterns: Advantages & Use Cases
Who It’s For: Long-term traders, investors, position traders
✅ Advantages:
- Stronger signals due to less noise
- Higher pattern success rate
- Better for spotting macro trends and large breakouts
- Ideal for double bottom, head and shoulders, cup and handle
🚫 Limitations:
- Fewer signals (1 candle per week)
- Slower pattern development = fewer trades
- Requires more patience and larger stops
Pattern Comparison: Daily vs Weekly
| Pattern | Daily Chart Behavior | Weekly Chart Behavior |
|---|---|---|
| Bull Flag | Quick breakout, short-term gains | Rare, but powerful continuation |
| Cup & Handle | Faster formation, more volatility | Longer, smoother handle and better confirmation |
| Double Bottom | Can be noisy, short pullbacks | Clean shape, higher success rate |
| Triangle | Faster breakout, possible fakeouts | More reliable breakouts with volume support |
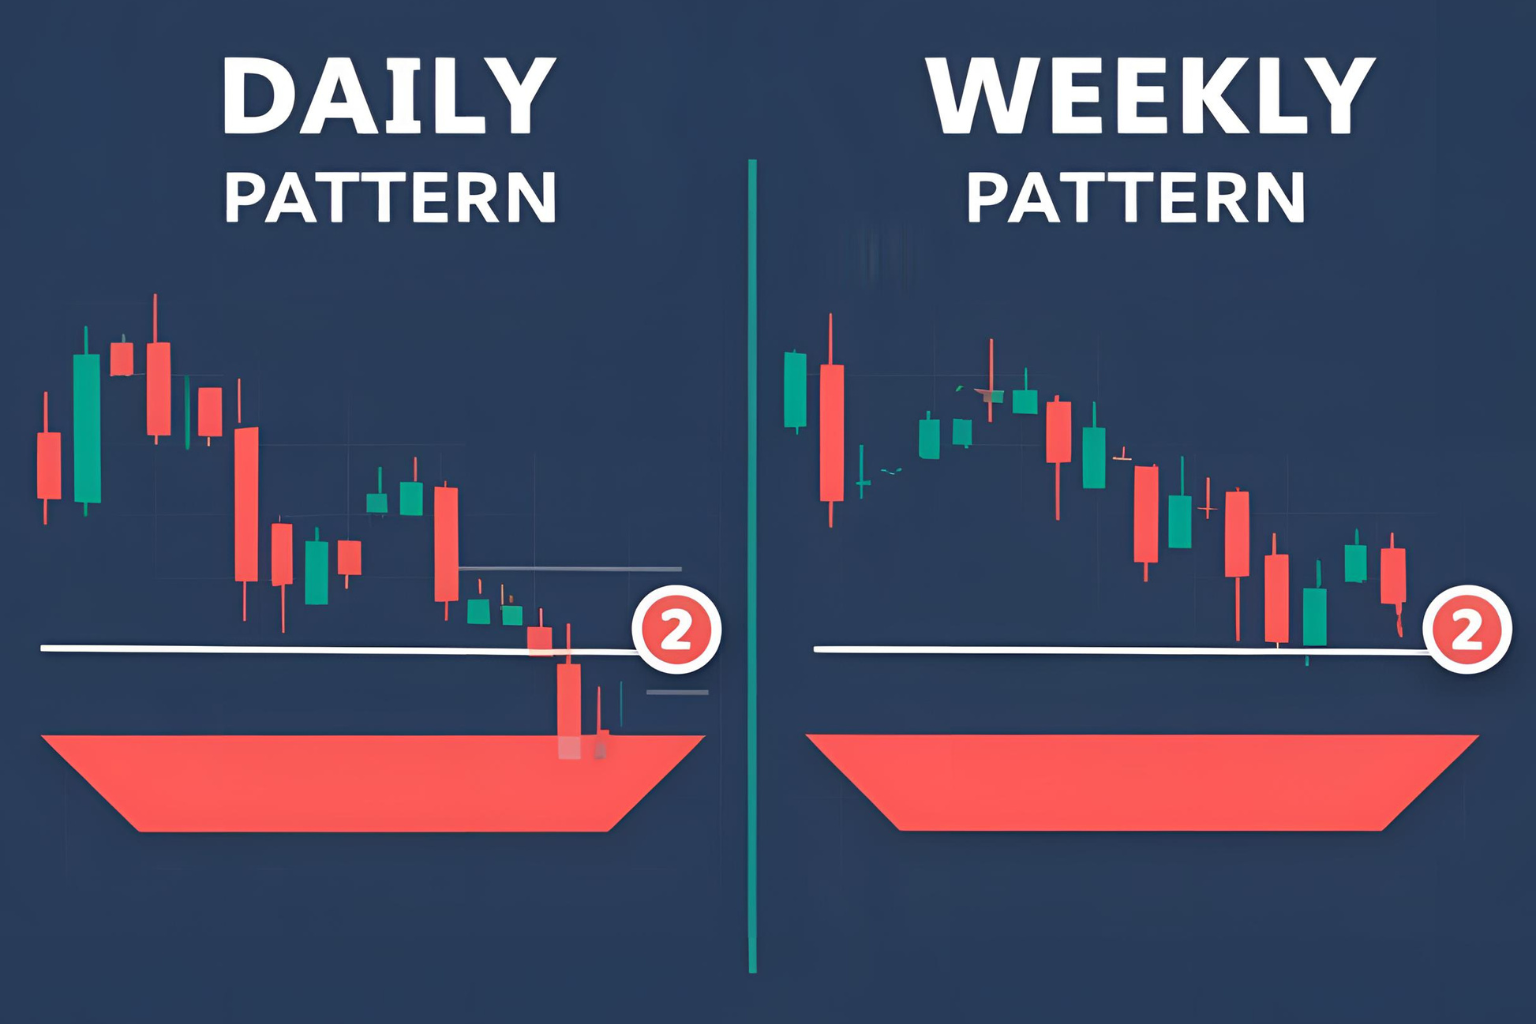
Example: Double Bottom on AAPL
- Daily Chart: Two lows within 1 week, quick bounce
- Weekly Chart: Same lows form over 6–8 weeks with strong base
- Outcome: Weekly pattern had better follow-through after breakout
Which Timeframe Should You Choose?
| If You Prefer… | Use This Timeframe |
|---|---|
| More trades, quicker setups | Daily charts |
| Fewer trades, higher accuracy | Weekly charts |
| Swing trading | Daily charts |
| Position trading or investing | Weekly charts |
Best Practice: Combine Both
- Use weekly chart to identify strong patterns and trend direction
- Use daily chart to fine-tune entry, stop-loss, and exit
- Multi-timeframe analysis = better decisions
FAQs
Are weekly chart patterns more accurate than daily ones?
Yes, they typically have a higher success rate due to reduced market noise.
Should I use both daily and weekly charts together?
Absolutely. Use the weekly for direction, and the daily for timing.
Which chart timeframe is best for crypto trading?
Daily charts are more commonly used due to 24/7 trading, but weekly charts help with long-term trends.
Can I swing trade using weekly charts?
Yes, but be ready for longer holding periods and wider stops.
Do patterns look the same on daily and weekly charts?
Sometimes, but many patterns are clearer and more reliable on the weekly timeframe.