How to Backtest Chart Patterns Effectively: A Step-by-Step Guide
Introduction
Before trading chart patterns with real money, it’s essential to know whether they actually work. That’s where backtesting comes in. Backtesting allows traders to evaluate how a chart pattern has performed in the past under specific rules. In this post, you’ll learn exactly how to backtest chart patterns effectively to improve your trading accuracy and confidence.
What Is Backtesting?
Backtesting is the process of testing a trading strategy on historical market data to see how it would have performed.
In the context of chart patterns, it helps answer:
- Which patterns perform best in different markets?
- What is the win rate, average profit, and risk for each setup?
- Are your entry and exit rules consistent and profitable?
Why Backtest Chart Patterns?
- Build Confidence: Validate your strategy before risking capital
- Avoid Random Trading: Trade with data-driven insights
- Refine Entry & Exit Rules: Optimize stop-loss and profit targets
- Eliminate Weak Patterns: Focus on high-probability setups
Tools to Backtest Chart Patterns
| Tool | Features |
|---|---|
| TradingView (Bar Replay) | Manually test patterns using historical candles |
| TrendSpider | Automated backtesting with pattern recognition |
| ThinkorSwim (Paper Trading Mode) | Simulate live trades using past data |
| MT4/MT5 + Indicators | Used in forex for indicator-based testing |
| Excel or Google Sheets | Manual logging and statistical analysis |
Step-by-Step: How to Backtest Chart Patterns
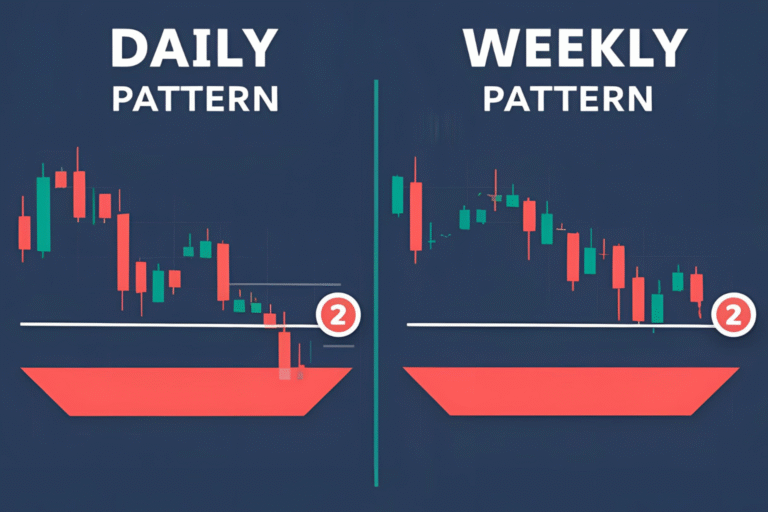
Step 1: Define the Pattern
Pick a pattern (e.g., double bottom, bull flag) and outline:
- Entry criteria
- Stop-loss level
- Take-profit level
- Timeframe to test
Step 2: Choose Market and Time Period
Example:
- Market: NASDAQ stocks
- Timeframe: 4H
- Period: 2021 to 2024
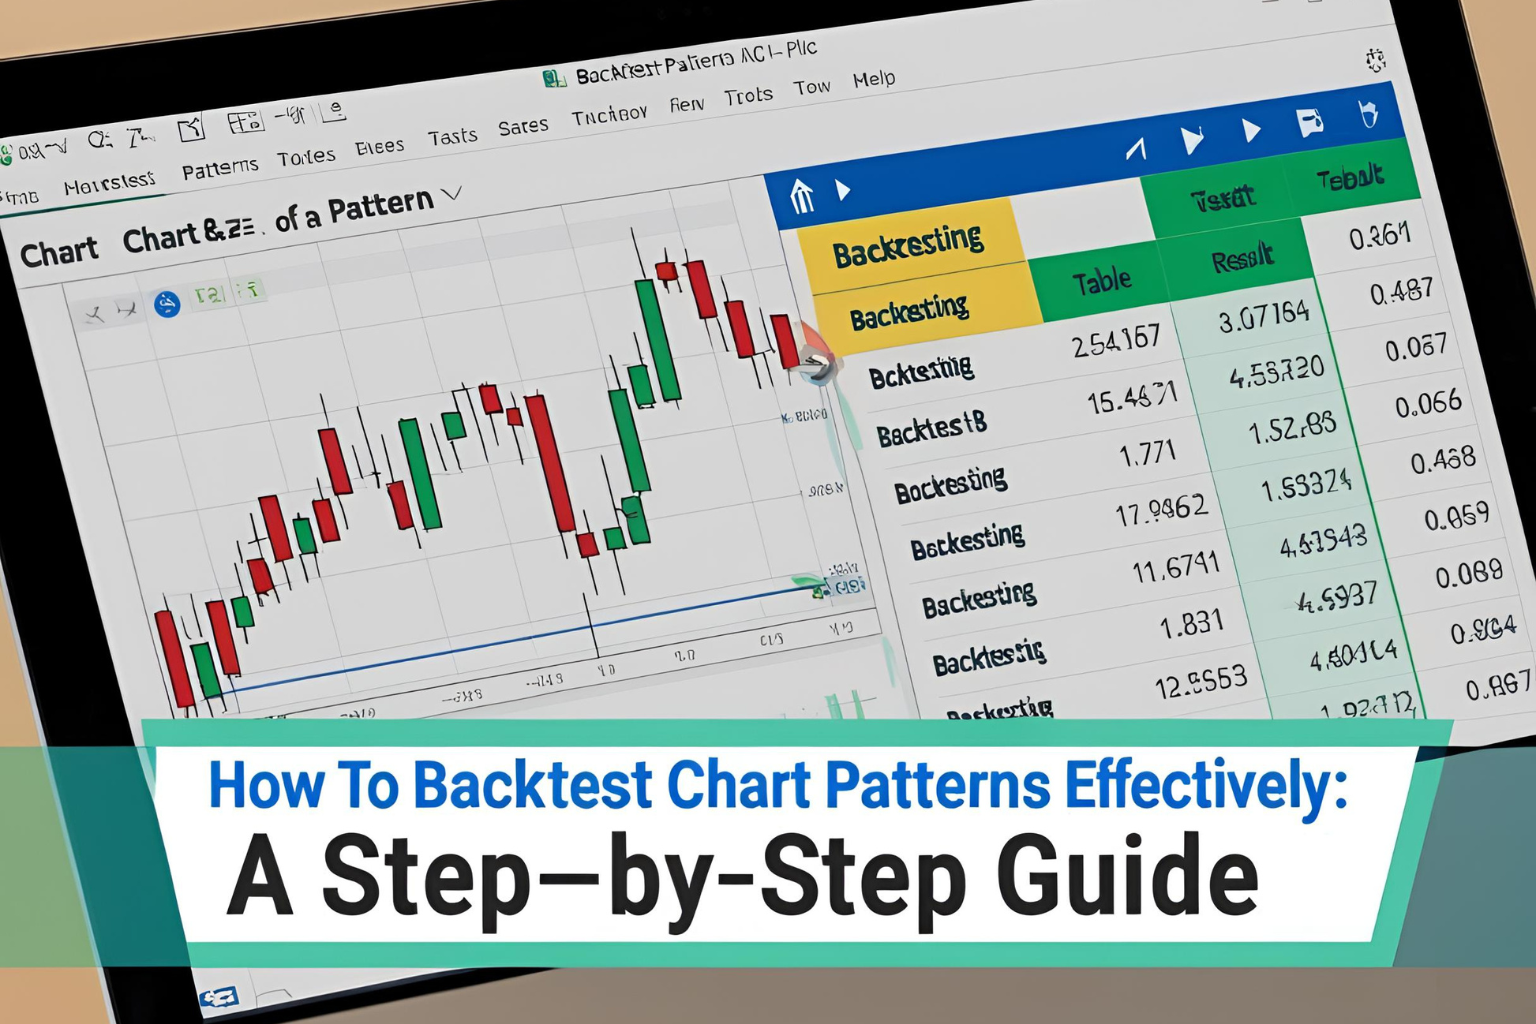
Step 3: Use a Chart Tool
Use TradingView’s Bar Replay to scroll through historical charts without seeing future candles. Spot the pattern and log your trades based on defined rules.
Step 4: Record the Data
Track each trade’s:
- Pattern type
- Entry & exit price
- Stop-loss & take-profit levels
- Result (win/loss)
- Comments or observations
Step 5: Analyze the Results
Calculate:
- Win rate
- Average reward-to-risk ratio
- Most successful pattern types
- Common reasons for failure
Step 6: Optimize
Adjust entry/exit rules and retest. For example:
- Move stop-loss tighter
- Use indicators like RSI for confirmation
- Shift to a higher timeframe for cleaner patterns
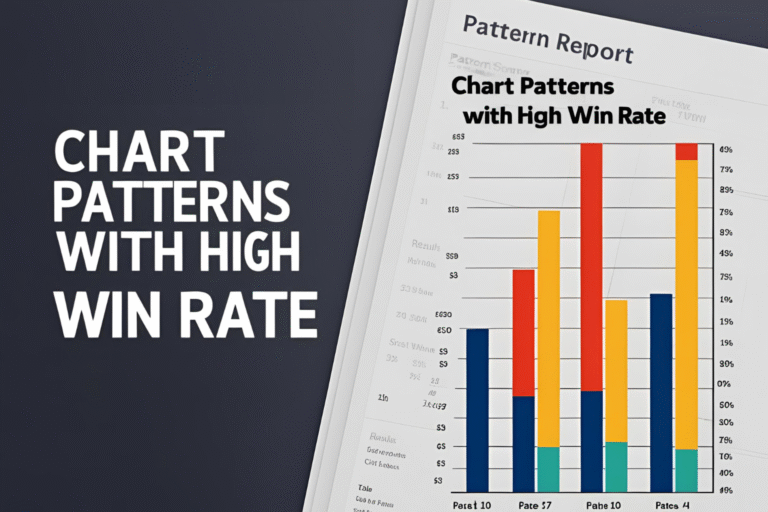
Example Backtest Summary: Double Bottom on S&P 500 Stocks
- Trades tested: 50
- Timeframe: Daily
- Win rate: 72%
- Avg R:R: 2.1:1
- Main finding: Patterns with volume confirmation performed better
Tips for Better Backtesting
- Always test at least 30–50 trades per pattern
- Be consistent with entry/exit rules
- Avoid cherry-picking trades
- Include both wins and losses
- Don’t skip sideways markets—test pattern resilience
FAQs
Is manual or automated backtesting better?
Manual backtesting helps you understand the pattern deeply. Automated tools are faster but less customizable.
What’s the ideal win rate for a chart pattern strategy?
Anything above 55–60% with a risk/reward ratio above 1.5:1 is solid.
Should I backtest in multiple markets?
Yes—patterns may behave differently in stocks vs. forex or crypto.
How long should I backtest a pattern?
Aim to test over multiple market conditions (bullish, bearish, sideways), ideally across 1–3 years of data.
Can beginners backtest effectively?
Yes, with tools like TradingView and a simple spreadsheet, anyone can start.