Using RSI and MACD with Chart Patterns for Better Trade Signals
Introduction
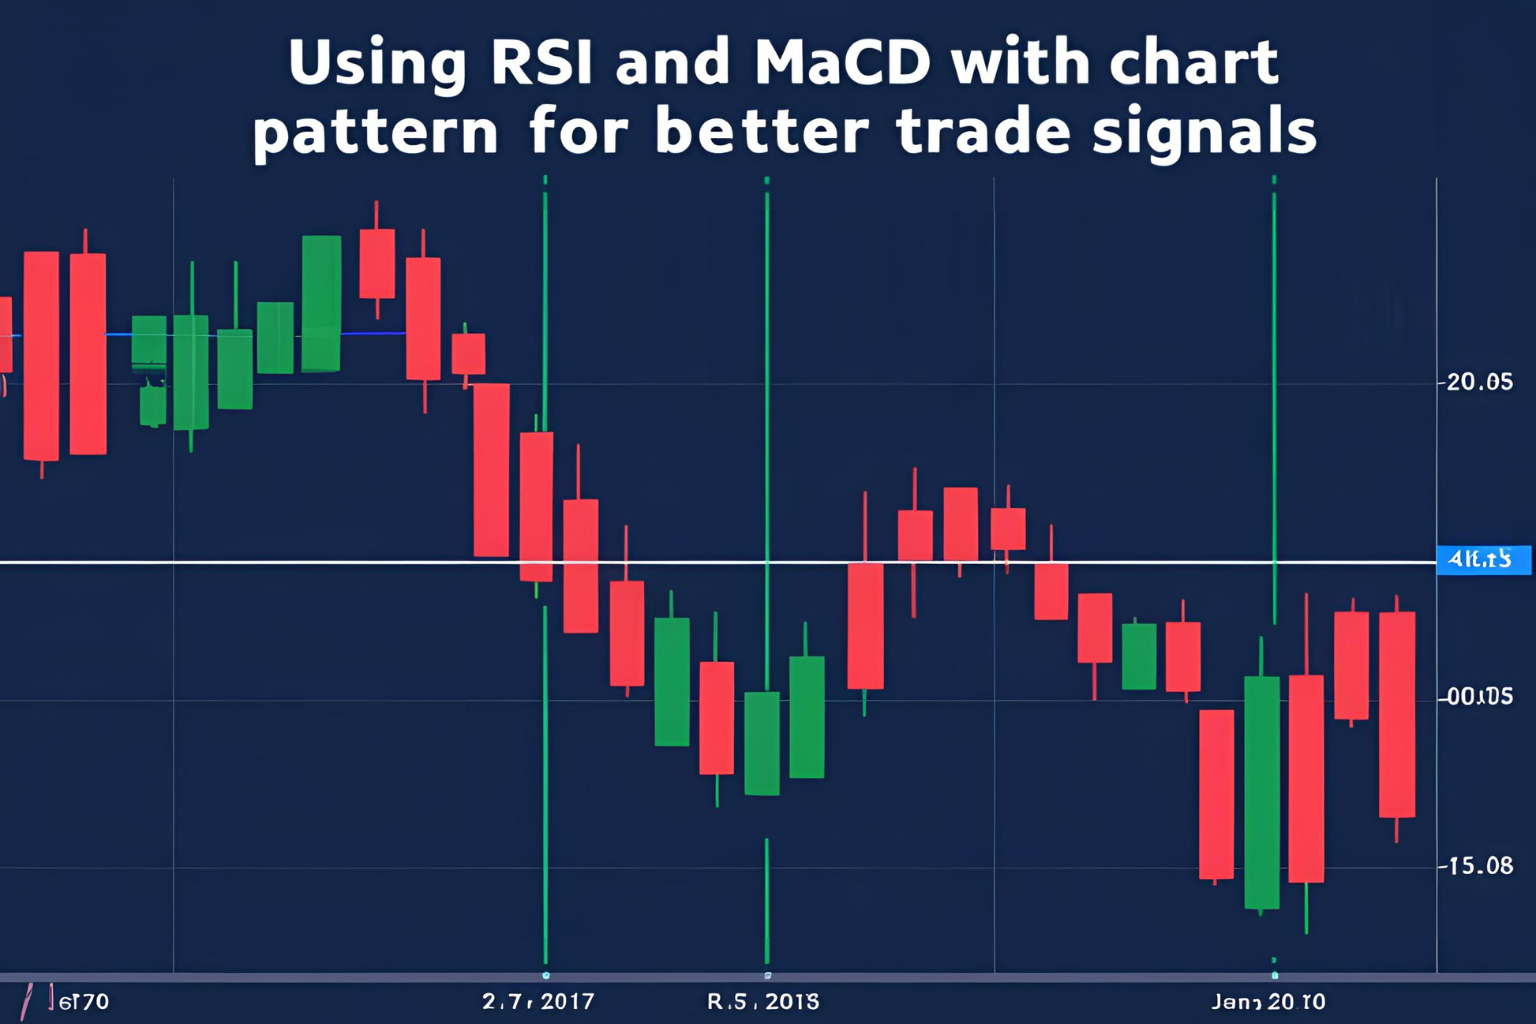
Chart patterns offer a solid visual roadmap for price movements, but when paired with powerful indicators like RSI and MACD, their effectiveness improves significantly. These combinations help filter out false breakouts and provide confirmation for higher-probability trades. In this guide, you’ll learn how to use RSI and MACD with chart patterns to enhance trade entries and exits in stocks, forex, crypto, and futures.
Why Combine Indicators with Chart Patterns?
- Stronger Confirmation: Avoids relying on price structure alone
- Filter False Setups: Helps ignore weak or premature breakouts
- Momentum Insight: RSI and MACD reveal trend strength and potential reversals
- Works Across Markets: Effective for swing and intraday setups
How to Use RSI with Chart Patterns
RSI (Relative Strength Index) measures overbought and oversold conditions.
🔹 Entry Confirmation
- Bullish Patterns (e.g., Double Bottom, Ascending Triangle):
Enter when RSI crosses above 50 on breakout - Bearish Patterns (e.g., Head and Shoulders, Descending Triangle):
Confirm short trade when RSI crosses below 50
🔹 Divergence Signal
- Bullish Divergence: Price forms lower lows while RSI forms higher lows
- Bearish Divergence: Price forms higher highs while RSI forms lower highs
Use Case: Confirms strength of reversal patterns like the inverse head and shoulders.
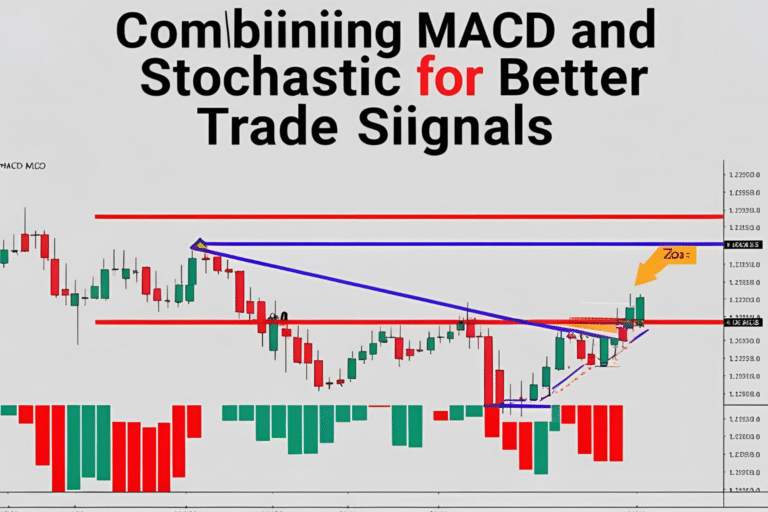
How to Use MACD with Chart Patterns
MACD (Moving Average Convergence Divergence) identifies trend direction and momentum shifts.
🔹 Entry Strategy
- Bullish Confirmation: MACD line crosses above signal line after breakout
- Bearish Confirmation: MACD line crosses below signal line after breakdown
🔹 Histogram Analysis
- Increasing histogram bars after a breakout = momentum building
- Decreasing histogram = weakening trend
Use Case: Combine MACD crossover with bullish flag breakouts for cleaner entries.
Best Patterns to Use with RSI and MACD
| Pattern | RSI Role | MACD Role |
|---|---|---|
| Double Bottom | Look for RSI > 50 or bullish divergence | Confirm with crossover |
| Head & Shoulders | RSI dropping confirms right shoulder | MACD histogram shrinking signals weakness |
| Cup & Handle | RSI climbing during handle | MACD crossover during breakout |
| Triangle (All Types) | Use RSI to confirm breakout momentum | Confirm with MACD histogram expansion |
Example Trade: Using Indicators with a Cup & Handle on BTC/USDT
- Pattern: Cup and handle on 4H chart
- Breakout Point: $42,000
- RSI: Crossed above 50
- MACD: Crossover confirmed + rising histogram
- Result: Strong rally to $45,000 within days
Tips for Success
- Don’t enter on indicators alone—combine with breakout from pattern
- Look for confluence: breakout + RSI signal + MACD crossover
- Avoid using RSI and MACD in sideways markets
- Always backtest your combination strategy on your preferred asset class
FAQs
Do I need both RSI and MACD with every chart pattern?
No, but using both gives you stronger confirmation—especially on reversal setups.
What RSI level confirms a bullish breakout?
Above 50 confirms momentum is turning positive.
Should I enter at the exact crossover of MACD?
Wait for crossover to align with the pattern breakout for best results.
Do RSI and MACD work on all timeframes?
Yes, but they are more reliable on 1H, 4H, and Daily charts.
Can I use these tools in crypto and forex trading?
Absolutely—they’re widely used across all asset classes.