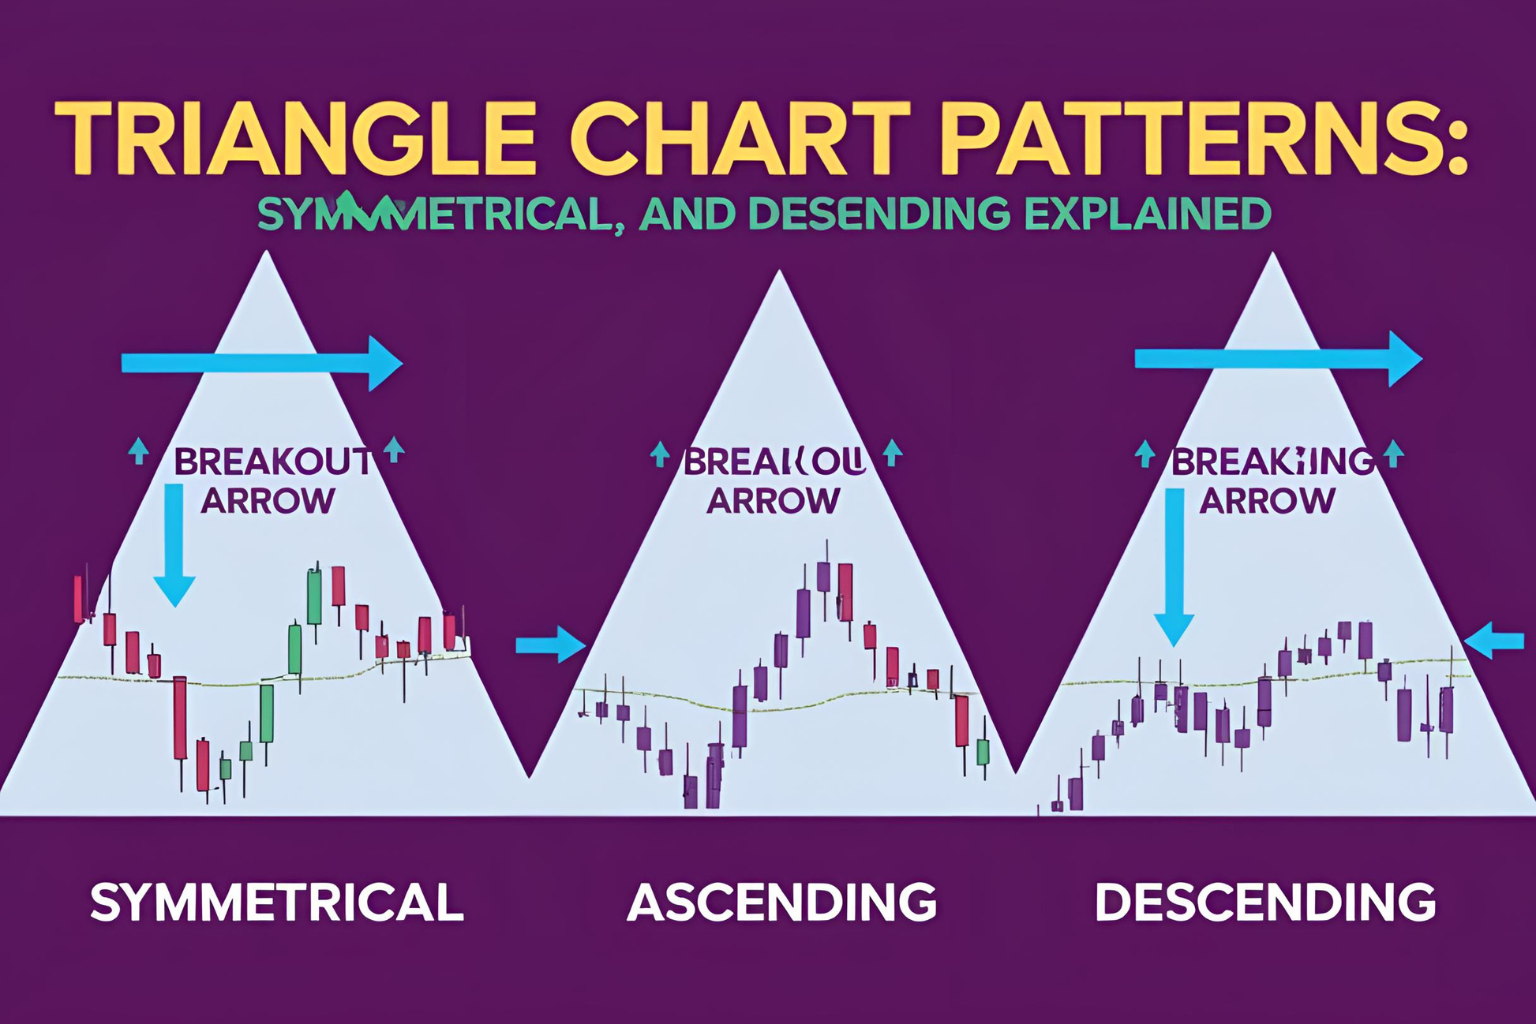
Triangle Chart Patterns: Symmetrical, Ascending, and Descending Explained
Introduction
Triangle chart patterns are among the most frequently observed and traded formations in technical analysis. These patterns signal periods of consolidation that typically end in breakouts. In this guide, we’ll break down the three primary types of triangle chart patterns—symmetrical, ascending, and descending—and show you how to trade each one effectively across stocks, forex, crypto, and futures.
What Are Triangle Chart Patterns?
Triangle patterns form when price action contracts into a narrowing range, bounded by trendlines. They typically indicate a potential breakout, with the direction depending on the type of triangle and the trend leading into it.
1. Symmetrical Triangle
Structure:
- Converging trendlines (lower highs and higher lows)
- No clear bias until breakout
Signal:
Neutral until breakout occurs
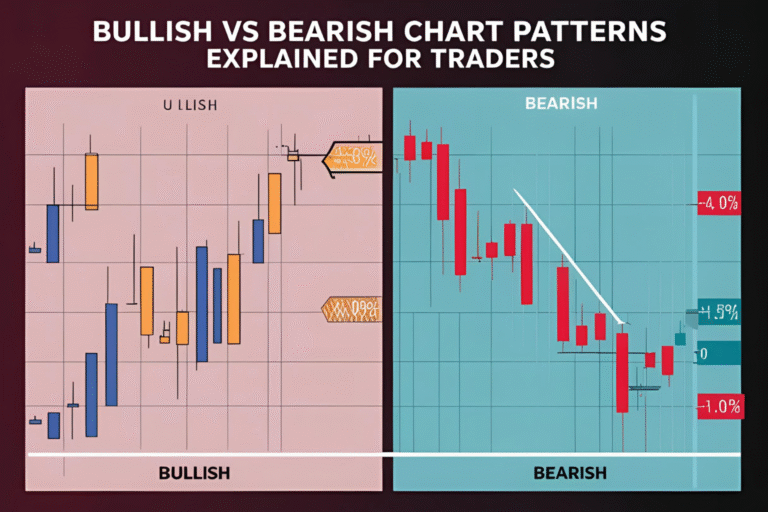
- Bullish breakout: Continuation of uptrend
- Bearish breakout: Reversal or continuation of downtrend
Best Used In:
Trending markets (stock, forex, crypto)
Entry Strategy:
Enter after a confirmed breakout with strong volume.
2. Ascending Triangle
Structure:
- Flat resistance on top
- Rising support line from below
Signal:
Bullish continuation pattern
Common In:
Uptrends where buyers repeatedly test resistance
Entry Strategy:
Buy on breakout above horizontal resistance with volume confirmation.
3. Descending Triangle
Structure:
- Flat support at the bottom
- Descending resistance from above
Signal:
Bearish continuation pattern
Seen In:
Downtrends, especially in crypto or forex pairs
Entry Strategy:
Sell short after breakdown below support with increasing volume.
Triangle Patterns vs. Wedges
| Feature | Triangle | Wedge |
|---|---|---|
| Trendlines | Converging | Sloping in same direction |
| Volume | Declines before breakout | Declines and then expands |
| Signal | Depends on breakout | Often suggests reversal |
Timeframes and Markets
- Stocks: Daily and 4H charts (e.g., SPY, AAPL)
- Crypto: 1H and 4H (BTC, ETH often form symmetrical triangles)
- Forex: Great for EUR/USD, USD/JPY on 1H, 4H, and Daily
- Futures: Triangle setups appear frequently in ES, NQ, CL
Example: Ascending Triangle on ETH/USDT
- Flat resistance: $2,500
- Rising support: Higher lows from $2,200
- Breakout: Above $2,500 on volume
- Target: Height of triangle added to breakout level
Confirmation Tools
- Volume Spike: Confirms breakout strength
- RSI Divergence: Adds reliability
- MACD Crossover: Helps time entries
FAQs
Which triangle pattern is most bullish?
The ascending triangle is considered most bullish due to repeated pressure on resistance.
Can symmetrical triangles break either way?
Yes. Wait for confirmation before trading.
How do I set a stop loss?
Below the lower trendline for bullish breakouts; above the upper line for bearish ones.
Are triangle patterns reliable in crypto trading?
Yes. They often precede major breakout moves in volatile coins.
Can triangle patterns appear on intraday charts?
Yes, especially 15m and 1H charts in futures and forex trading.